IMAGE

Figure 1

ID
ZDB-IMAGE-230630-33
Source
Figures for Turrini et al., 2023
Image
Figure Caption

Figure 1

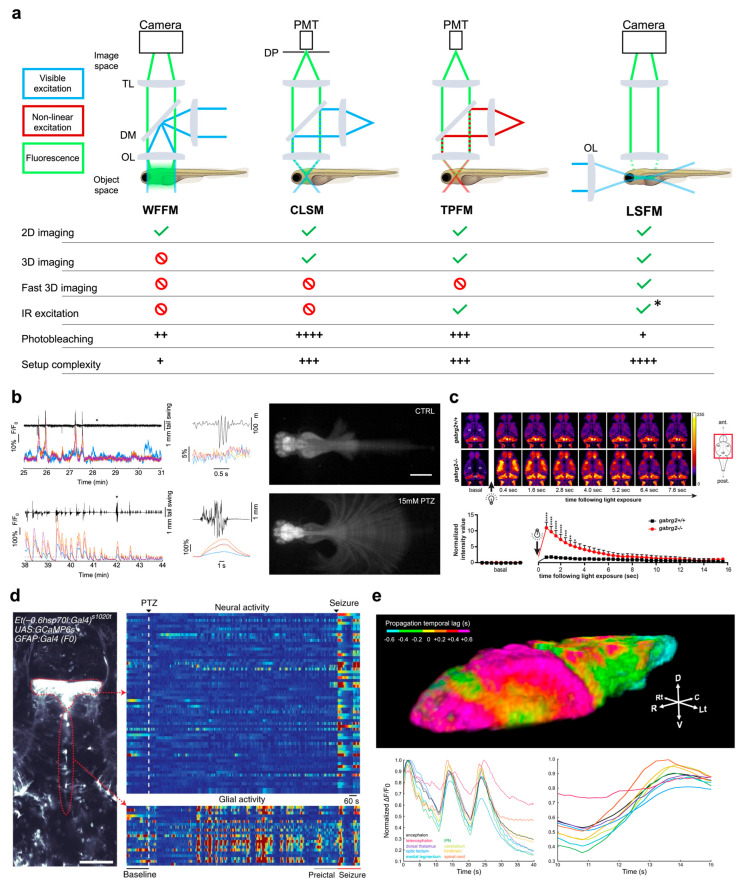
Functional imaging. (a) Top, schematics of the main imaging techniques adopted to perform functional imaging in zebrafish larvae: wide-field fluorescence microscopy (WFFM), confocal laser scanning microscopy (CLSM), two-photon fluorescence microscopy (TPFM), and light-sheet fluorescence microscopy (LSFM). Abbreviations: objective lens (OL), dichroic mirror (DM), tube lens (TL), photomultiplier tube (PMT), detection pinhole (DP). Bottom, table reporting the main imaging modalities achievable (green check) or not (red prohibition symbol) with each of the above techniques. The table also reports typical drawbacks (i.e., photobleaching and system complexity) quantified on a scale from one to four (black plus). Asterisk indicates that LSFM can employ IR excitation yet only in its multiphoton version. (b) Example of WFFM imaging performed on a pharmacological model of acute seizure. The wide field-of-view achievable with this technique enables to record calcium activity from four main brain districts (ΔF/F0 colored traces; telencephalon in blue, optic tectum in orange, cerebellum in yellow and hindbrain in purple) along with tail movements (black trace) in both physiological conditions (upper panels) and acute motor seizures (lower panels). Asterisks indicate the point of the traces shown, with expanded time scale, in the central panels of the figure. Images on the left represent maximum intensity projections of a motor behavior typical of physiological (upper) and pathological (lower) conditions. Scale bar: 500 μm. Figure adapted from [28], distributed under the terms of the Creative Commons Attribution License (CC-BY). (c) Representative single brain plane functional imaging performed using CLSM on GCaMP6f larvae expressing normal GABAA receptor (upper row) and larvae knockout for the γ2 GABAA receptor subunit (lower row). As visible in the temporal sequences and in the lower plot, knockout larvae (red data in the plot) show hyperexcitability to light which produces a transient seizure focused in the optic tectum. Figure taken from [36], distributed under the terms of the Creative Commons Attribution License (CC-BY). (d) Left, example of single-brain plane functional imaging using TPFM on larval zebrafish expressing GCaMP6s in thalamic neurons (upper red dotted outline) and periventricular glial cells (lower red dotted outline). Right, glial cells show increased activity (warmer colors) in the minutes preceding overt neuronal seizures. Scale bar: 100 μm. Figure taken from [39], distributed under the terms of the Creative Commons Attribution License (CC-BY). (e) Representative results obtained using 2P-LSFM whole-brain functional imaging on zebrafish larvae pan-neuronally expressing GCaMP6s. Above, 3D rendering of the temporal propagation dynamic of an ictal event during pharmacologically induced seizure. Colder and warmer colors represent regions reaching the peak of ictal activity earlier and later, respectively, with respect to the whole-brain average dynamic, as indicated by the color bar. Below, fluorescence traces highlighting the difference in temporal dynamic of the activity coming from different brain districts (color-coded as in the legend). Figure adapted with permission from [49] © The Optical Society.

Acknowledgments
This image is the copyrighted work of the attributed author or publisher, and ZFIN has permission only to display this image to its users. Additional permissions should be obtained from the applicable author or publisher of the image. Full text @ Int. J. Mol. Sci.