
- Title
-
4D Light-sheet imaging and interactive analysis of cardiac contractility in zebrafish larvae
- Authors
- Zhang, X., Almasian, M., Hassan, S.S., Jotheesh, R., Kadam, V.A., Polk, A.R., Saberigarakani, A., Rahat, A., Yuan, J., Lee, J., Carroll, K., Ding, Y.
- Source
- Full text @ APL Bioeng
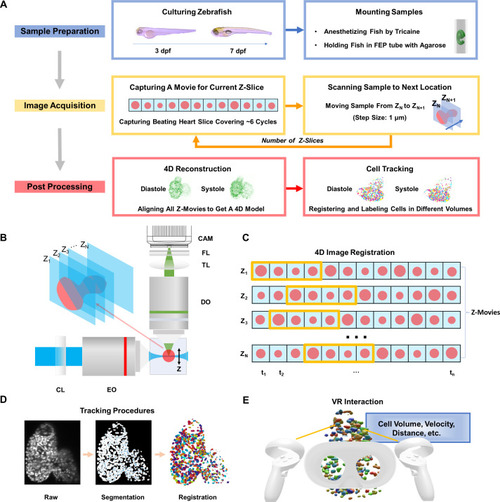
4D light-sheet fluorescence microscopy (LSFM) framework for zebrafish heart imaging and analysis. (a) Workflow of the zebrafish cardiac activity analysis, including major steps from zebrafish preparation in standard E3 medium with phenylthiourea (PTU) and tricaine, to 4D image acquisition, and to reconstruction and single cell tracking. (b) Simplified schematic illustration of the customized LSFM system construction. CL: cylindrical lens. EO: excitation objective. DO: detection objective. TL: tube lens. FL: filter. CAM: sCMOS camera. (c) Illustration of retrospective synchronization for 4D zebrafish image registration. Z-movie indicates a continuous image sequence at a certain depth along the z-axis. Each frame in the image sequence is represented by a red dot, and the starting and ending phases from end-diastole to end-systole are highlighted in the yellow box. (d) Procedures of cell segmentation and tracking. Raw, segmented, and successively registered images are presented from left to right. Individual cells are coded using pseudo-colors. (e) User-directed interaction, including cell selection and quantitative analysis, has been achieved in the virtual environment. |
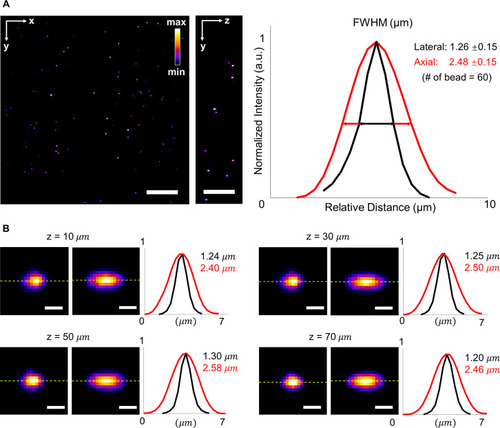
Full width at half maximum (FWHM) of beads captured by LSFM at various depths. (a) Raw data of fluorescent beads in a volume of ∼300 × 300 × 75 |

Parallel computation for 4D image registration. (a) Procedures of using parallel computation to register different Z-movies. The initial step was to determine the cardiac cycle. Each CPU core was assigned to initialize the calculation process for one movie, and the GPU was utilized to match a targeted image in red with others in yellow that correspond to the same cardiac phase in subsequent cardiac cycles within the same Z-movie. The matched frame was marked with an additional red box. The next step involved aligning Z-movies in different depths to start from the same cardiac phase. Each CPU core was assigned to initialize the calculation process between two consecutive movies, and the GPU was used to match the targeted image in red with others in yellow that correspond to the same cardiac phase in the next Z-movie. (b) Quantitative comparison of the processing time between parallel computing and sequential computing. The registration time for different numbers of frames (on the left) and movies (on the right) improved by over tenfold in both the overall process (at the top) and in individual steps (at the bottom). |
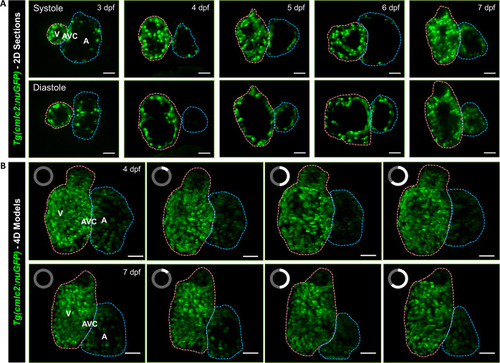
Light-sheet imaging of GFP-labeled cardiomyocyte nuclei in the transgenic |
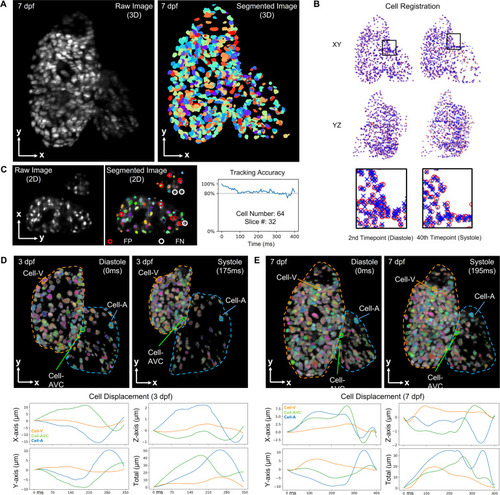
Cell tracking results for zebrafish beating heart. (a) Raw and segmented images of |
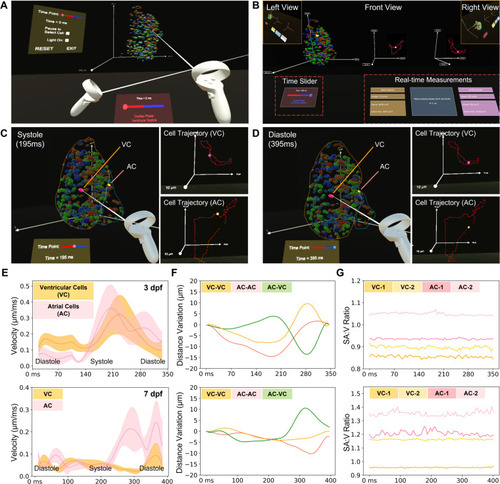
Manipulative functionalities of our VR platform on 4D zebrafish heart models. (a) The VR platform provides users with an immersive viewing and interactive experience of a 4D zebrafish heart model, allowing us to visualize and analyze the heart function in a user-defined mode over time. (b) Overview of the analyzing tool in VR. The available interactions in the VR platform include cell selection, time point selection, time pause, and lighting adjustment. Trajectories for the selected cells are displayed as dotted lines, and a glowing point indicates the current position in the trajectory. After cell selection, the VR platform provides quantitative analysis outputs, including velocity, volume, surface area, and relative distance if two cells are selected. (c) and (d) To validate the platform's functions, we randomly selected two cells in the ventricle and atrium (VC: ventricular cell and AC: atrial cell) and compared their traces at different time points. (e)–(g) After collecting the measurement results from our VR platform, we compared the velocity and relative distance change in one cardiac cycle between selected cells, and the SA:V ratio for selected cells in different heart regions at 3 (top) and 7 dpf (bottom), respectively. (e) The average velocity changes in five ventricular cells and five atrial cells. (f) The relative distance changes between three groups of cells, i.e., two ventricular cells, a ventricular cell and an atrial cell, and two atrial cells. (g) SA:V ratio change of four randomly selected ventricular and atrial cells during one cardiac cycle are depicted over the time course. |