FIGURE

FIG. 4.

ID
ZDB-FIG-230625-12
Publication
Zhang et al., 2023 - 4D Light-sheet imaging and interactive analysis of cardiac contractility in zebrafish larvae
Other Figures
All Figure Page
Back to All Figure Page
FIG. 4.

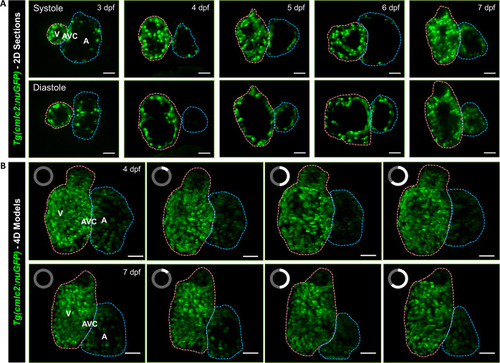
Light-sheet imaging of GFP-labeled cardiomyocyte nuclei in the transgenic Tg(cmlc2:nucGFP) zebrafish larvae. (a) Cardiac contraction was captured from ventricular systole to diastole in 3–7 days post fertilization (dpf), respectively. (b) 4D Reconstruction of contracting hearts in zebrafish larvae at 4 (top) and 7 dpf (bottom) was presented as a maximum intensity projection (MIP) image. The clock on the upper left of each frame indicates the cardiac phase starting from end-systole. Cardiac ventricle and atrium are depicted in pink and blue, respectively. V: ventricle. A: atrium. AVC: atrioventricular canal. Scale bar: 30 μm.

Expression Data

Expression Detail
Antibody Labeling
Phenotype Data

Phenotype Detail
Acknowledgments
This image is the copyrighted work of the attributed author or publisher, and ZFIN has permission only to display this image to its users. Additional permissions should be obtained from the applicable author or publisher of the image. Full text @ APL Bioeng