FIGURE

FIG. 5.

ID
ZDB-FIG-230625-13
Publication
Zhang et al., 2023 - 4D Light-sheet imaging and interactive analysis of cardiac contractility in zebrafish larvae
Other Figures
All Figure Page
Back to All Figure Page
FIG. 5.

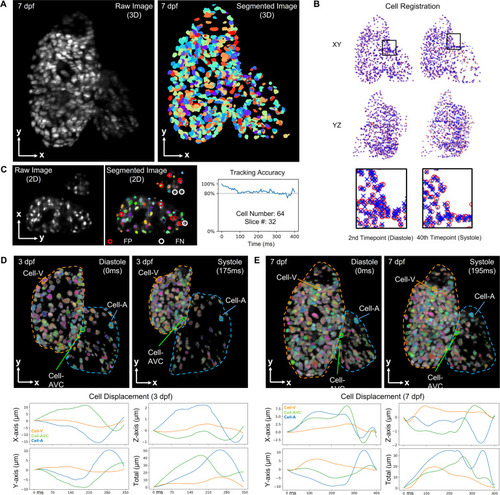
Cell tracking results for zebrafish beating heart. (a) Raw and segmented images of Tg(cmlc2:nucGFP) zebrafish heart at 7 dpf were presented as a MIP image. The total number of tracked cells is 580. (b) Cell tracking algorithm enabled us to register cells among various cardiac phases. Manually corrected cells in the first volume were denoted as red circles, while the cells registered by 3DeeCellTracker in target next volume were denoted as blue crosses. (c) Assessment of the tracking accuracy in 64 cells over time. The results indicate false positive (FP) labels where non-cell regions were labeled as cells and false negative (FN) labels where specific cells were not detected. Individual cells were assigned pseudo-colors to differentiate them. (d) and (e) Further displacement analysis allowed for the tracking of representative cells in the ventricle, atrium, and AVC in the 3D space at 3 and 7 dpf, respectively.

Expression Data

Expression Detail
Antibody Labeling
Phenotype Data

Phenotype Detail
Acknowledgments
This image is the copyrighted work of the attributed author or publisher, and ZFIN has permission only to display this image to its users. Additional permissions should be obtained from the applicable author or publisher of the image. Full text @ APL Bioeng