
- Title
-
hapln1a+ cells guide coronary growth during heart morphogenesis and regeneration
- Authors
- Sun, J., Peterson, E.A., Chen, X., Wang, J.
- Source
- Full text @ Nat. Commun.

a Uniform manifold approximation and projection (UMAP) clustering of tcf21+ single-cells from juvenile hearts. b Heatmap of the top 10 markers for epicardial cells from juvenile tcf21:nucEGFP hearts. c Identification of epicardial cell clusters based on gene ontology analysis. d Feature plot of hapln1a expression in epicardial clusters of juvenile hearts. e Heatmap of gene ontology enrichment for tcf21+/hapln1a+ epicardial cells vs. tcf21+/hapln1a- cells. f Log2-fold-change vs. abundance of normalized gene expression of tcf21+/hapln1a+ epicardial cells vs. tcf21+/hapln1a- cells. Each point designates a unique gene; differentially expressed unique genes are in red. Unique genes with higher expression in tcf21+/hapln1a+ epicardial cells have positive fold-change values, whereas unique genes with higher expression in tcf21+/hapln1a- cells have negative fold-change values. |
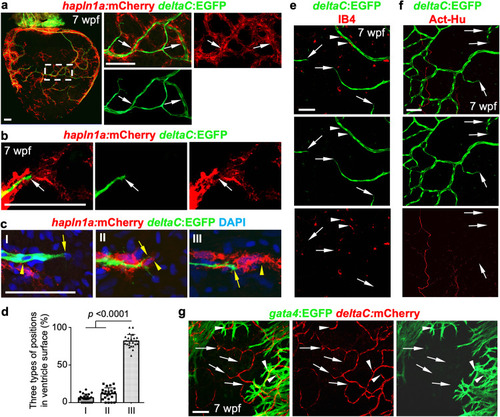
a Whole-mount view of hapln1a+ cells and deltaC:EGFP+ coronary endothelial cells on hapln1a:mCherry-NTR;deltaC:EGFP ventricular surface (opposite the atrioventricular junction) at 7 weeks post-fertilization (wpf). The boxed area is enlarged. Arrows indicate deltaC:EGFP+ cells lining with hapln1a+ cells. n = 50 animals. Scale bar, 100 µm. b Representative images of hapln1a+ cells located ahead of deltaC:EGFP+ cells in the juvenile ventricular surface. Arrows indicate coronary tips. Total 50 animals have been examined from 3 independent experiments with similar results. Scale bar, 50 µm. c The three position types of hapln1a+ cells according to their localization with coronary sprouts in the juvenile heart surface: hapln1a+ cells behind (I), parallel (II), and leading (III) deltaC+ cells. Arrows, front of deltaC+ cells. Arrowheads, front of hapln1a+ cells. Scale bar, 50 µm. d Quantification of the three types of positions from experiments in c. I, 6%; II, 12%; III, 82%. n = 23 animals. Mann–Whitney rank-sum test (Two-sided). Data are presented as mean values ± SD. Source data are provided as a Source Data file. e Growing deltaC+ cell extensions and macrophages (IB4+) in juvenile hearts. Arrowheads represent IB4+ macrophages flanking coronary vessels. Arrows represent deltaC+ vessel extensions. n = 8 animals. Scale bar, 50 µm. f Growing deltaC+ cell extensions and AcT-Hu+ nerves in juvenile hearts. Arrows represent EGFP+ vessel extensions. n = 5 animals. Scale bar, 50 µm. g Growing deltaC+ cell extensions and gata4+ CMs in juvenile hearts. Arrows represent deltaC+ vessel extensions outside gata4+ CM area. Arrowheads represent deltaC+ vessel extensions embedded in gata4+ CM area. n = 8 animals. Scale bar, 50 µm. |

a Visualization of the growth of deltaC:EGFP+ and hapln1a:mCherry+ tissues from deltaC:EGFP;hapln1a:mCherry hearts over 7 days after in vitro culture. deltaC:EGFP+ tissue growth is clearly lagging behind hapln1a:mCherry+ cells. Arrows represent growing coronary extensions. Total 5 tissue aggregates were examined. The experiments were repeated two times independently with similar results. Scale bar, 50 µm. b Live imaging of hapln1a+ and deltaC+ cells in the ventricular surface of ex vivo juvenile hearts by 0, 6, and 12 h, respectively. Total 12 hearts were observed from three independently experiments with similar results. Visualization of deltaC:EGFP+ coronary growth following existing hapln1a+ cell shears is clear (32 out of 39 observed extension growth). Arrows represent growing coronary tips. Arrowheads represent growing deltaC+ tips lacking hapln1a+ linear cell structures. Scale bar, 50 µm. |
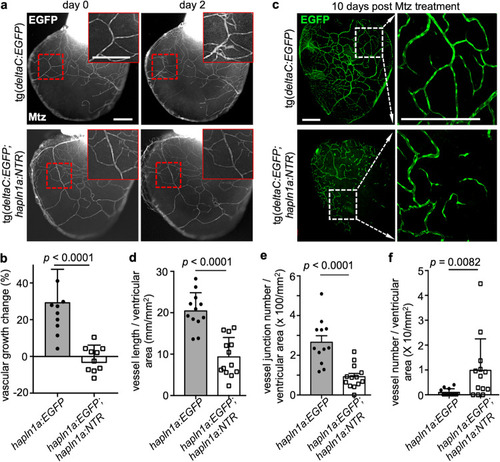
a Obvious ex vivo deltaC+ cell growth (red boxes included) within 2 days in control deltaC:EGFP hearts and no growth in deltaC:EGFP;hapln1a:NTR hearts, after Mtz treatment. The experiment was repeated once. Scale bar, 200 µm. b Quantification of pixels of EGFP+ signals at day 2 versus that at day 0 in experiment (a). n = 11 in each group. Mann–Whitney rank-sum test (two-sided). Data are presented as mean values ± SD. Source data are provided as a Source Data file. c Whole-mount view of the ventricular surface from in vivo juvenile deltaC:EGFP;hapln1a:NTR (n = 13) and deltaC:EGFP (n = 12) clutchmates at the age of 8 wpf that were treated with 10 mM Mtz for 12 h at day 0, day 1, and day 5, and then the hearts were extracted at day 10 and analyzed. The experiment was repeated once. Scale bars, 200 µm. d–f Quantification of pixels of EGFP+ signals (d), vessel junctions (e), and isolated vessels (f) versus whole ventricular area in experiment c. In the quantifications in d, e, f, n = 13 juvenile deltaC:EGFP;hapln1a:NTR fish and n = 12 juvenile deltaC:EGFP fish. The experiment was repeated once with similar results. d, e, f, Mann-Whitney Rank Sum test (Two-sided). Data are presented as mean values ± SD. Source data are provided as a Source Data file. |

a Whole-mount view of coronary vessels and hapln1a+ cells in the wound area of adult injured deltaC:EGFP;hapln1a:mCherry animals. White dashed box is enlarged in single confocal slices. Arrows label the coronary tips. White dashed line circles the closing wound. n = 10 animals. Scale bars, 50 µm. b 3-D visualization of coronary sprouts and hapln1a+ cells in the regenerating area in experiment (a). Arrow represents the coronary tip lagging behind hapln1a+ cells. Scale bars, 50 µm. c Section views of coronary vessels in the wounded area in adult injured deltaC:EGFP;hapln1a:mCherry animals and deltaC:EGFP siblings, with Mtz treatment by 30 dpa. Brackets represent the regenerated area. Scale bars, 50 µm. d Quantification of EGFP+ pixels in the regenerating site from (c). n = 18 deltaC:EGFP and n = 22 deltaC:EGFP;hapln1a:mCherry animals were used. The experiments were repeated at least once. Mann–Whitney rank-sum test (Two-sided). Data are presented as mean values ± SD. Source data are provided as a Source Data file. |

a Visualization of hapln1a:EGFP+ cells and in situ signals of serpine1 mRNA in whole-mount view of the ventricular surface of juvenile hapln1a:EGFP animals. Red dashed rectangle is enlarged. Red arrowheads indicate in situ signals, located in hapln1a+ cells. n = 6. Scale bar, 50 µm. b In situ of serpine1 mRNA in section views of adult injured hapln1a:EGFP hearts. Red arrowheads indicate in situ signals distributed in EGFP+ cells, which are near the area of coronary vessel regrowth. Yellow dashed lines represent surgery plane. Red dashed lines outline ventricular apex. Red rectangle area is enlarged in c. n = 5. Scale bar, 50 µm. c Representative image of serpine1 in situ signals located in EGFP+ cells in the wound area. Red arrowheads indicate in situ signals. Scale bar, 25 µm. |

a Visualization of EGFP+ cells and in situ signals of serpine1 mRNA in whole-mount view of the ventricular surface of juvenile deltaC:EGFP animals. Red dashed rectangle is enlarged. Red arrow indicates coronary sprouts and arrowheads indicate in situ signals. The serpine1 in situ signals are located laterally and ahead of EGFP+ signals. n = 7. Scale bar, 50 µm. b Quantification of the two types of positions: serpine1 signals within 30 µm. of coronary extensions and more than 30 µm, from experiments in a. n = 10 animals. The 69% quantified coronary extensions have serpine1 signals within 30 µm in radius, and 31% of counted coronary extensions have no serpine1 signals within 30 µm. Mann–Whitney rank-sum test (two-sided); made for two comparisons. Data are presented as mean values ± SD. Source data are provided as a Source Data file. c In situ of serpine1 mRNA in section views of adult injured deltaC:EGFP hearts. Red arrowheads indicate in situ signals. Yellow dashed lines represent surgery plane. Red dashed lines outline ventricular apex. Yellow rectangle area is enlarged in d. Red arrowheads label serpine1 in situ signals in the wound edge. n = 5. Scale bar, 50 µm. d 3-D view of serpine1 in situ signals and deltaC:EGFP+ cells in the wound area. Red arrow indicates the coronary tip located in the area distributed with in situ signals. Scale bar, 200 µm. |

a Daily imaging of EGFP+ coronary cells in juvenile deltaC:EGFP ventricular surface treated with serpine1 inhibitor (n = 7) or vehicle treatment (n = 5) ex vivo. The experiment was repeated once. Scale bars, 50 µm. b Quantification of the percentage of EGFP+ pixels on the ventricular surface from experiments in a. The experiment was repeated once with similar results. Mann–Whitney rank-sum test (two-sided). Data are presented as mean values ± SD. Source data are provided as a Source Data file. c Visualization of EGFP+ coronary cells in whole-mounted juvenile deltaC:EGFP hearts at the age of 7 wpf after serpine1 inhibitor (n = 6) and vehicle treatment (n = 8). The experiment was repeated once. White dashed lines, ventricle. Scale bars, 200 µm. d Quantification of the percentage of EGFP+ pixels on the ventricular surface from experiments in c. The experiment was repeated once with similar results. Mann–Whitney rank-sum test (two-sided). Data are presented as mean values ± SD. Source data are provided as a Source Data file. e Section images of ventricles of vehicle- or serpine1 inhibitor-treated deltaC:EGFP animals at 30 dpa, assessed for EGFP+ coronary cells in the injury site. n = 8 in vehicle control and n = 7 in serpine1 inhibitor-treated group. The experiment was repeated once. Brackets, injury site used for quantification. Dashed line indicates amputation plane. Scale bars, 50 µm. f Quantification of the percentage of EGFP+ pixels in the regenerating area from experiments in e. The experiment was repeated once with similar results. Mann–Whitney rank-sum test (two-sided). Data are presented as mean values ± SD. Source data are provided as a Source Data file. |

a Whole-mount views of coronary cells and HA signals on the ventricular surface of juvenile deltaC:EGFP fish, treated with Mtz for 2 days and hearts collected at 5 days post treatment. Arrows represent the coronary sprouts lining with organized HA signals and arrowheads represent the coronary sprouts without organized HA signals. Scale bars, 50 µm. b Quantification of HA+ signal area per HA aggregate from experiments in a. n = 6 deltaC:EGFP and n = 7 deltaC:EGFP;hapln1a:NTR fish were used. Mann–Whitney rank-sum test (two-sided). Data are presented as mean values ± SD. Source data are provided as a Source Data file. c Section images of ventricles of deltaC:EGFP and deltaC:EGFP;hapln1a:NTR fish treated with Mtz from 2 dpa for 3 continuous days and hearts were collected at 7 dpa and assessed for HA signals in the injury site. Scale bar, 50 µm. d Quantification of the HA+ signal area per HA aggregate in the injury edges from experiments in c. 8 fish for each group were analyzed. Mann–Whitney rank-sum test (two-sided). Data are presented as mean values ± SD. Source data are provided as a Source Data file. The experiment was repeated once with similar results. e Whole-mount views of coronary cells and HA signals on the ventricular surface of juvenile deltaC:EGFP fish, treated with vehicle and Tiplaxtinin for 7 continuous days. Arrows represent the coronary growth extensions lining with organized HA signals and arrowheads represent the coronary sprouts without organized HA signals. Scale bars, 50 µm. f Quantification of HA+ signal area per HA aggregate from experiments in e. 6 animals were used for each group. Mann-Whitney Rank Sum test (Two-sided test). Data are presented as mean values ± SD. Source data are provided as a Source Data file. The experiment was repeated once with similar results. g Section images of ventricles of deltaC:EGFP fish treated with vehicle or Tiplaxtinin from 3 to 6 dpa, and analyzed at 7 dpa, assessed for HA signals in the injury site. Scale bar, 50 µm. h Quantification of the HA+ signal area per HA aggregate in the injury edges from experiments in g. n = 8 vehicle control and n = 7 inhibitor-treated fish were used. Mann–Whitney rank-sum test (two-sided). Data are presented as mean values ± SD. Source data are provided as a Source Data file. The experiment was repeated once with similar results. |