
|
Fig. 9
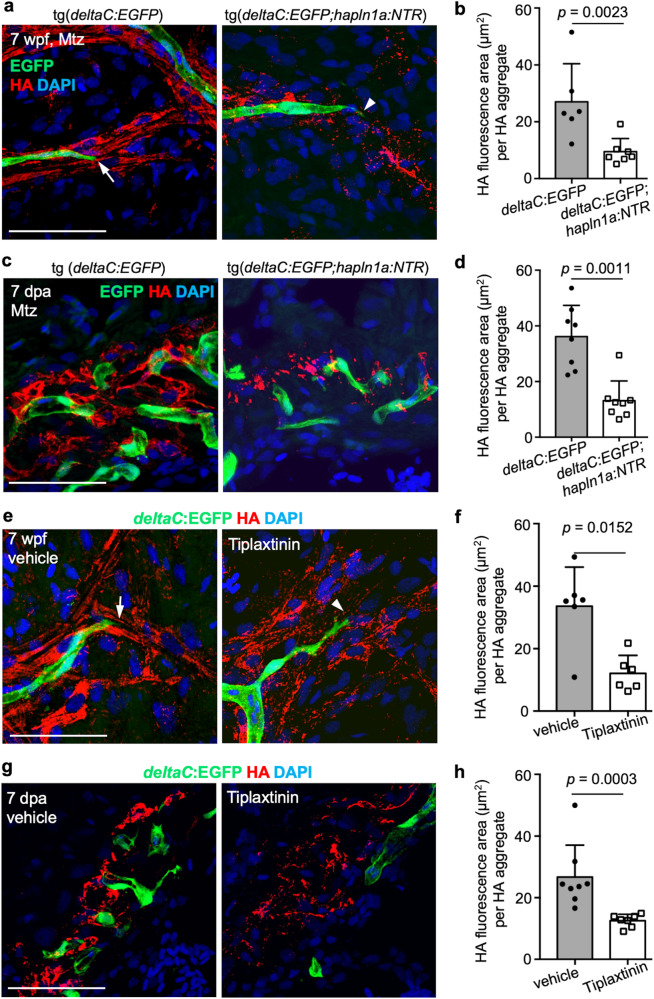
a Whole-mount views of coronary cells and HA signals on the ventricular surface of juvenile deltaC:EGFP fish, treated with Mtz for 2 days and hearts collected at 5 days post treatment. Arrows represent the coronary sprouts lining with organized HA signals and arrowheads represent the coronary sprouts without organized HA signals. Scale bars, 50 µm. b Quantification of HA+ signal area per HA aggregate from experiments in a. n = 6 deltaC:EGFP and n = 7 deltaC:EGFP;hapln1a:NTR fish were used. Mann–Whitney rank-sum test (two-sided). Data are presented as mean values ± SD. Source data are provided as a Source Data file. c Section images of ventricles of deltaC:EGFP and deltaC:EGFP;hapln1a:NTR fish treated with Mtz from 2 dpa for 3 continuous days and hearts were collected at 7 dpa and assessed for HA signals in the injury site. Scale bar, 50 µm. d Quantification of the HA+ signal area per HA aggregate in the injury edges from experiments in c. 8 fish for each group were analyzed. Mann–Whitney rank-sum test (two-sided). Data are presented as mean values ± SD. Source data are provided as a Source Data file. The experiment was repeated once with similar results. e Whole-mount views of coronary cells and HA signals on the ventricular surface of juvenile deltaC:EGFP fish, treated with vehicle and Tiplaxtinin for 7 continuous days. Arrows represent the coronary growth extensions lining with organized HA signals and arrowheads represent the coronary sprouts without organized HA signals. Scale bars, 50 µm. f Quantification of HA+ signal area per HA aggregate from experiments in e. 6 animals were used for each group. Mann-Whitney Rank Sum test (Two-sided test). Data are presented as mean values ± SD. Source data are provided as a Source Data file. The experiment was repeated once with similar results. g Section images of ventricles of deltaC:EGFP fish treated with vehicle or Tiplaxtinin from 3 to 6 dpa, and analyzed at 7 dpa, assessed for HA signals in the injury site. Scale bar, 50 µm. h Quantification of the HA+ signal area per HA aggregate in the injury edges from experiments in g. n = 8 vehicle control and n = 7 inhibitor-treated fish were used. Mann–Whitney rank-sum test (two-sided). Data are presented as mean values ± SD. Source data are provided as a Source Data file. The experiment was repeated once with similar results.