
- Title
-
Non-Invasive Monitoring of Cutaneous Wound Healing in Non-Diabetic and Diabetic Model of Adult Zebrafish Using OCT Angiography
- Authors
- Kim, J., Kim, S., Choi, W.J.
- Source
- Full text @ Bioengineering (Basel)
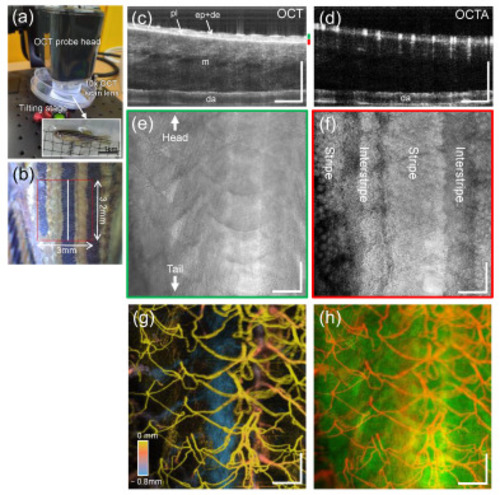
OCTA imaging of a transgenic adult zebrafish before wounding. (a) Anesthetized zebrafish placed on the tilting stage under the OCT probe head, and (b) closeup of a left flank of the zebrafish including a scanned region (red box, 3.0 mm × 3.2 mm). (c,d) Representative OCT and OCTA cross-sectional images obtained at a location (white line in (b)), exhibiting structural and vascular information (pl: pigment layer, ep + de: epidermis, m: muscle, da: dorsal aorta). (e,f) En face (x-y) views of the tissue layers segmented at two specific depths (green and red bars in (c)). (g) Pseudo-colored cutaneous vessel network of the zebrafish trunk obtained from the maximum intensity projection (MIP) of the OCTA dataset. The hotter color is closer to the surface. (h) Overlaid image of (e,g), where the white dotted line indicates a single scale involving the capillary network. Scale bars: 500 μm. |

β-cell ablation and regeneration. (a) Fluorescence images of the control zebrafish beta cells compared with MTZ-treated zebrafish β-cells. (b) Blood glucose levels in the control and MTZ-treated zebrafish. β-cell ablation results that return to control levels by MTZ + 14 days. Significance levels are ** p < 0.003, and n.s p > 0.05. |
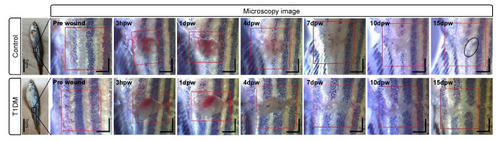
Bright-field microscopy images of the control (up) and T1DM (down) adult zebrafishes before wounding (pre-wound) and at 3 h, 1 day, 4 days, 7 days, 10 days, and 15 days post-wounding. Red boxes are the scanned areas involving the induced wounds. Scale bars: 1 mm. |
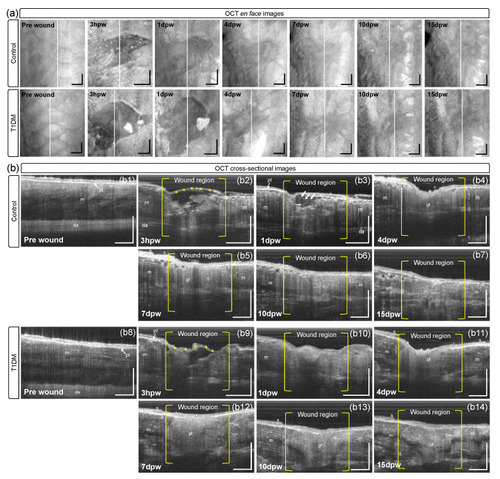
(a) En face OCT images of the red boxes in Figure 3. (b) Representative OCT cross-sectional images taken at white lines in (a), exhibiting structural changes in the wound regions of control (b2–b7) and diabetic fish (b9–b14) compared to their baselines (pre-wound), control (b1) and diabetic fish (b8). m: muscle, pl: pigmented layer, gt: granulation tissue, s: scale, da: dorsal aorta. Scale bars: 500 μm. |
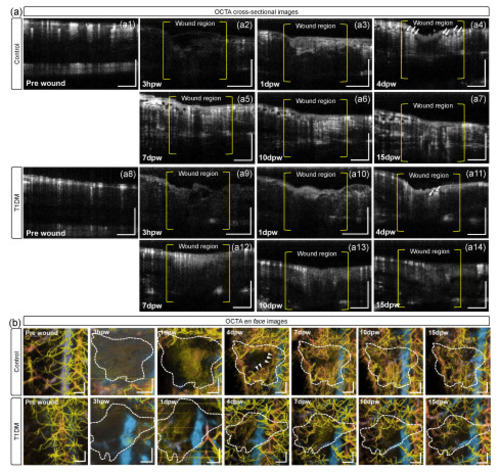
(a) Representative OCTA cross-sectional images obtained at the locations (white lines in Figure 2), corresponding to the OCT cross-sectional images in Figure 4b, exhibiting vascular information in pre-wound (a1) and post-wound regions of control (a2–a7), and pre-wound (a8) and post-wound regions of diabetic fish (a9–a14) over 15 dpw. (b) En face OCTA images (angiograms) of the time-course changes in the cutaneous microvascular networks in the wound regions (dotted areas) of control and diabetic fish over 15 dpw. The hotter color is closer to the skin surface. Scale bars: 500 μm. |

(a) Representative cross-sectional OCTA image of a 3D OCTA dataset. Based on the dataset, an OCTA slab is extracted at the depth range (green dotted lines), including the vascularized tissue under the epidermis. (b,c) MIP images of the extracted OCTA slabs in the control and diabetic zebrafish models. (d,e) Binary image of the wound area selectively cropped from (b,c). (f,g) Wound vessel area density (VAD) map calculated with (d,e). (h) The wound VADs (mean ± SEM) at different time points in non-diabetic (control) and diabetic groups. Significance levels are * p < 0.03, ** p < 0.003, and *** p < 0.001. Scale bars: 500 μm. |