
FIGURE
Figure 4
- ID
- ZDB-FIG-230530-12
- Publication
- Kim et al., 2023 - Non-Invasive Monitoring of Cutaneous Wound Healing in Non-Diabetic and Diabetic Model of Adult Zebrafish Using OCT Angiography
- Other Figures
- All Figure Page
- Back to All Figure Page
Figure 4
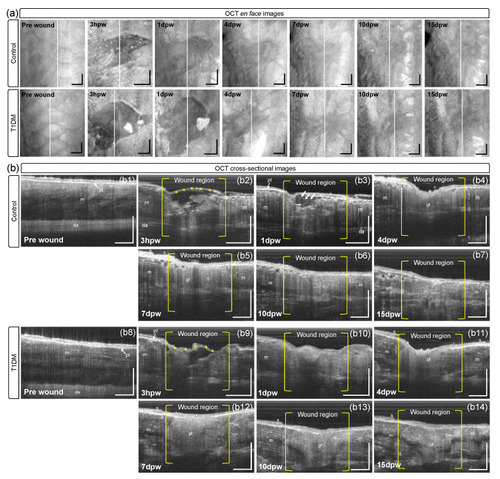
(a) En face OCT images of the red boxes in Figure 3. (b) Representative OCT cross-sectional images taken at white lines in (a), exhibiting structural changes in the wound regions of control (b2–b7) and diabetic fish (b9–b14) compared to their baselines (pre-wound), control (b1) and diabetic fish (b8). m: muscle, pl: pigmented layer, gt: granulation tissue, s: scale, da: dorsal aorta. Scale bars: 500 μm. |
Expression Data
Expression Detail
Antibody Labeling
Phenotype Data
Phenotype Detail
Acknowledgments
This image is the copyrighted work of the attributed author or publisher, and
ZFIN has permission only to display this image to its users.
Additional permissions should be obtained from the applicable author or publisher of the image.
Full text @ Bioengineering (Basel)