
|
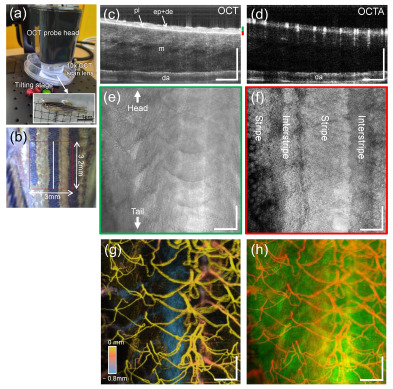
Figure 1
OCTA imaging of a transgenic adult zebrafish before wounding. (a) Anesthetized zebrafish placed on the tilting stage under the OCT probe head, and (b) closeup of a left flank of the zebrafish including a scanned region (red box, 3.0 mm × 3.2 mm). (c,d) Representative OCT and OCTA cross-sectional images obtained at a location (white line in (b)), exhibiting structural and vascular information (pl: pigment layer, ep + de: epidermis, m: muscle, da: dorsal aorta). (e,f) En face (x-y) views of the tissue layers segmented at two specific depths (green and red bars in (c)). (g) Pseudo-colored cutaneous vessel network of the zebrafish trunk obtained from the maximum intensity projection (MIP) of the OCTA dataset. The hotter color is closer to the surface. (h) Overlaid image of (e,g), where the white dotted line indicates a single scale involving the capillary network. Scale bars: 500 μm.