
FIGURE
Figure 5
- ID
- ZDB-FIG-230530-13
- Publication
- Kim et al., 2023 - Non-Invasive Monitoring of Cutaneous Wound Healing in Non-Diabetic and Diabetic Model of Adult Zebrafish Using OCT Angiography
- Other Figures
- All Figure Page
- Back to All Figure Page
Figure 5
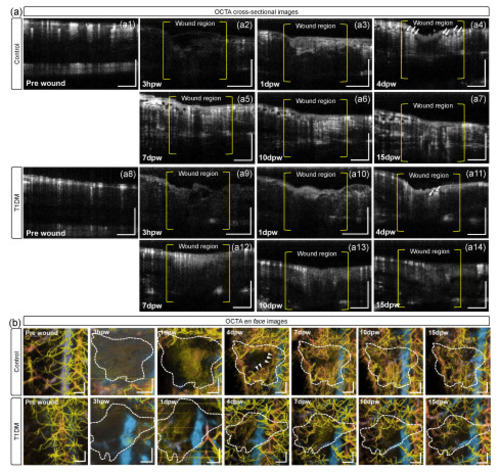
(a) Representative OCTA cross-sectional images obtained at the locations (white lines in Figure 2), corresponding to the OCT cross-sectional images in Figure 4b, exhibiting vascular information in pre-wound (a1) and post-wound regions of control (a2–a7), and pre-wound (a8) and post-wound regions of diabetic fish (a9–a14) over 15 dpw. (b) En face OCTA images (angiograms) of the time-course changes in the cutaneous microvascular networks in the wound regions (dotted areas) of control and diabetic fish over 15 dpw. The hotter color is closer to the skin surface. Scale bars: 500 μm. |
Expression Data
Expression Detail
Antibody Labeling
Phenotype Data
Phenotype Detail
Acknowledgments
This image is the copyrighted work of the attributed author or publisher, and
ZFIN has permission only to display this image to its users.
Additional permissions should be obtained from the applicable author or publisher of the image.
Full text @ Bioengineering (Basel)