
- Title
-
Foxm1 regulates cardiomyocyte proliferation in adult zebrafish after cardiac injury
- Authors
- Zuppo, D.A., Missinato, M.A., Santana-Santos, L., Li, G., Benos, P.V., Tsang, M.
- Source
- Full text @ Development
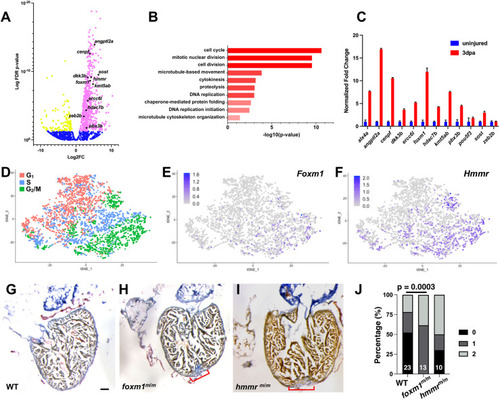
Identification of mitotic genes involved in cardiac regeneration. (A) Representative volcano plot of RNA-seq from uninjured versus 3 dpa adult ventricles. Magenta denotes genes with increased transcripts at 3 dpa, yellow represents decreased transcripts and blue represents genes with no significant change. (B) Genes with increased transcription were analyzed with FAC (DAVID) and biological processes were ranked by z-score. (C) qPCR validation was performed on candidate genes and the representative image shown depicts fold change+s.d. (D) scRNA-seq showed E10.5 embryonic left ventricular cardiomyocytes sorted by cell cycle phase. (E,F) Foxm1 (E) and Hmmr (F) were present in G2 and M phase cardiomyocytes. (G-I) Representative images from WT 30 dpa (G; n=22), foxm1m/m 30 dpa (H; n=13) and hmmrm/m 30 dpa (I; n=7) hearts stained with AFOG. AFOG staining labels fibrin (red), collagen (blue) and muscle (orange-brown). Red brackets indicate presence of fibrotic tissue. (J) Scar area was qualitatively scored: 0, no visible scar; 1, small amount of fibrosis with some collagen and fibrin stain; 2, medium to large amount of fibrosis with collagen and fibrin stain. Increased fibrotic area was noted in foxm1 mutant hearts compared with WT controls. Statistical significance was calculated using Fisher's exact test. Scale bars: 50 μm. |
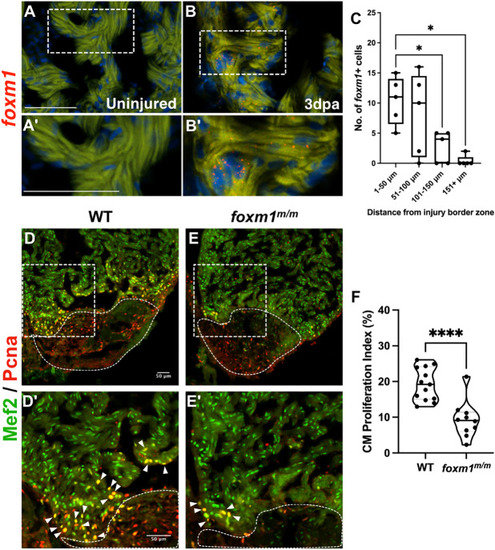
Loss of foxm1 significantly limits cardiomyocyte proliferation after ventricular resection. (A-B′) Fluorescence in situ hybridization revealed foxm1 (red) is not expressed in the uninjured myocardium (A,A′) but is detected in border zone cardiomyocytes after injury (B,B′). The myocardium is marked by 488 nm as background fluorescence. (C) foxm1+ cardiomyocytes were localized within 100 µm from the injury and expression decreased distal to the wound. Box plots show minimum to maximum. The whiskers show the minimum and up to the maximum value, with the middle line representing the median. Each point represents foxm1+ cardiomyocytes from each heart with respect to distance from the border zone. Each point is representative of an individual heart (n=5). (D-E′) WT (D,D′; n=13) and foxm1m/m (E,E′; n=10) hearts at 7 dpa stained for the cardiomyocyte nuclei marker Mef2 (green) and proliferation marker Pcna (red). White dotted lines represent the injury border. Arrowheads indicate proliferating cardiomyocytes. (F) Cardiomyocyte proliferation index is significantly decreased in foxm1m/m hearts. Each point on the truncated violin plot represents an individual heart and these data represent three biological replicates. The middle line represents the median. Statistical significance was calculated using one-way ANOVA multiple comparison test. *P<0.05, ****P<0.0001. A′,B′,D′,E′ show magnified images of boxed areas in A,B,D,E, respectively. Scale bars: 50 μm. |

foxm1+ cardiomyocytes are localized near nrg1+ cells and are epistatic to the Mapk regulator, dusp6. (A,B) In situ hybridization showing nrg1 (green) and foxm1 (red) in WT 7 dpa hearts. (C) foxm1+ cardiomyocytes were proximal to nrg1+ non-myocytes. A total of 21 nrg1+ cells were scored in WT 7 dpa hearts (n=5). Box plots show minimum to maximum. The whiskers show the minimum and up to the maximum value, with the middle line representing the median. (D-G) dusp6m/+;foxm1m/+ fish were bred to generate double mutants to assess their epistatic relationship. dusp6m/m hearts (E; n=7), dusp6m/+;foxm1m/+ (D; n=6), dusp6m/m;foxm1m/+ hearts (F; n=6) and dusp6m/m;foxm1m/m hearts (G; n=6) were stained with Mef2 (green) and Pcna (red). White dotted lines represent the injury border. White arrowheads indicate representative Pcna+/Mef2+ cardiomyocytes. (H) Graph showing CM proliferation index. Each point on the truncated violin plot represents an individual heart and these data represent three biological replicates. The middle line represents the median. (I) In situ hybridization for foxm1 was performed in WT (n=3) vehicle treated with 50% DMSO and erbb2+/m (n=2) hearts treated with AG1478. The number of foxm1+ cardiomyocytes was quantified in control and erbb2+/m-treated hearts. Each point on the truncated violin plot represents an individual heart and is averaged from four sections. The middle line represents the median. Statistical significance was calculated using two-tailed, unpaired Student's t-test and one-way ANOVA multiple comparison test. ***P=0.0006 (two-tailed, unpaired Student's t-test, C); **P=0.0022, ****P<0.0001 (one-way ANOVA, H); *P=0.0416 (two-tailed, unpaired Student's t-test, I). Scale bars: 50 μm. |
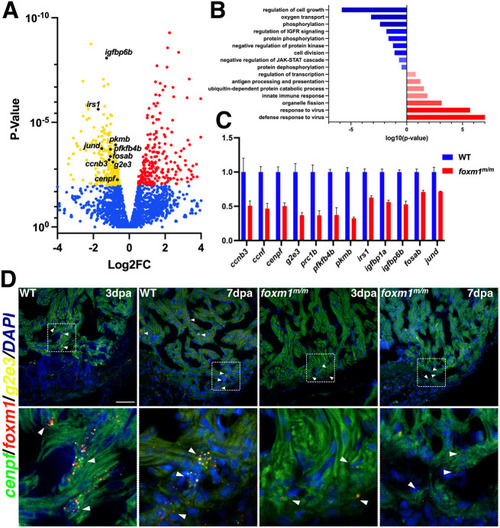
Injured foxm1m/m hearts show reduced expression of G2 and M phase cell cycle genes. (A) Representative volcano plot showing WT versus foxm1m/m 3 dpa gene expression from RNA-seq. Genes involved in cell cycle progression, insulin signaling, glycolysis and the AP-1 transcription factor family were significantly downregulated in the foxm1 mutant hearts. Red and yellow points indicate increased and decreased expression, respectively. Blue represents genes with no significant change. (B) FAC (DAVID) confirmed decreased activity of cell division and insulin signaling, whereas innate immune response is increased. (C) qPCR validation on a subset of the genes with data represented as fold change normalized to WT 3 dpa expression+s.d. (D) Fluorescence in situ hybridization of foxm1 (red) and the cell cycle genes g2e3 (yellow) and cenpf (green) show co-expression in a subset of border zone cardiomyocytes in WT 3 dpa and 7 dpa hearts, whereas foxm1+/g2e3+/cenpf+ cardiomyocytes were rarely detected in the foxm1 mutants. White arrowheads indicate representative foxm1+/g2e3+/cenpf+ cardiomyocytes within the injury border zone. Scale bar: 50 μm. |
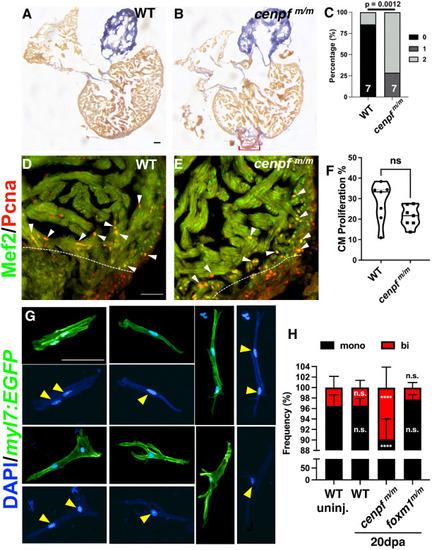
Proportion of binucleated cardiomyocytes were increased in cenpfm/m hearts. (A,B) WT (A; n=8) and cenpfm/m (B; n=8) 30 dpa hearts stained with AFOG to label fibrotic tissue. AFOG staining was used to label fibrin (red), collagen (blue) and muscle (orange-brown). Red bracket indicates fibrotic tissue. (C) Scar area was qualitatively scored: 0, no visible scar; 1, small amount of fibrosis with some collagen and fibrin stain; 2, medium to large amount of fibrosis with collagen and fibrin stain. (D-F) WT (D; n=7) and cenpfm/m (E; n=7) 7 dpa hearts showed no significant difference in cardiomyocyte proliferation index (F). White dotted lines represent the injury border and white arrowheads indicate Mef2+/Pcna+ cardiomyocytes. Truncated violin plot with each point representing an individual heart and these data represent three biological replicates. The middle line represents the median. (G,H) Individual cardiomyocytes were isolated from uninjured and 20 dpa hearts extracted from Tg(myl7:EGFP), Tg(myl7:EGFP); cenpfm/m and foxm1m/m zebrafish to count mononucleated versus binucleated cardiomyocytes. Representative images of mononucleated and binucleated cardiomyocytes are shown (G). Yellow arrowheads indicated nuclei from representative mononucleated and binucleated cardiomyocytes. The frequency (%) of WT uninjured (n=11 hearts; 1945 CMs; binucleation=3.52%), cenpfm/m uninjured (n=11; 3204 CMs; binucleation=7.24%), WT 20 dpa (n=11; 1858 CMs; binucleation=3.45%), cenpfm/m 20 dpa (n=12; 3072 CMs; binucleation=9.90%) and foxm1m/m 20 dpa (n=9; 2827 CMs; binucleation=2.28%) mononucleated (black) versus binucleated (red) cardiomyocytes was determined (H). Statistical analysis for AFOG was performed using the Fisher's exact test (C). CM proliferation index was calculated using the two-tailed, unpaired Student's t-test (F). Mononucleated versus binucleated counts used two-way ANOVA with Dunnett's multiple comparisons test (H). ****P<0.0001. n.s., not significant. Scale bars: 50 μm. |
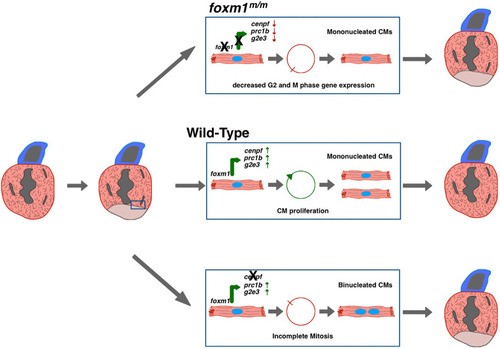
A preliminary model indicating requirement of foxm1 and cenpf expression in border zone cardiomyocyte cell cycle progression and mitosis. In post-injury hearts, a subpopulation of border zone cardiomyocytes express foxm1. Foxm1 transcriptionally activates expression of cell cycle genes such as cenpf, g2e3 and prc1b to promote regeneration of the lost myocardium (middle). In the absence of foxm1 (top), induction of these G2 and M phase genes is decreased and border zone cardiomyocytes do not proliferate. In the absence of cenpf (bottom), cardiomyocytes may progress through the cell cycle until M phase, when Cenpf protein is required for chromatid separation. These dividing cells likely undergo cytokinetic dysregulation, which results in failed mitosis, generating binucleated cardiomyocytes. |