
Fig. 1.
|
Fig. 1.
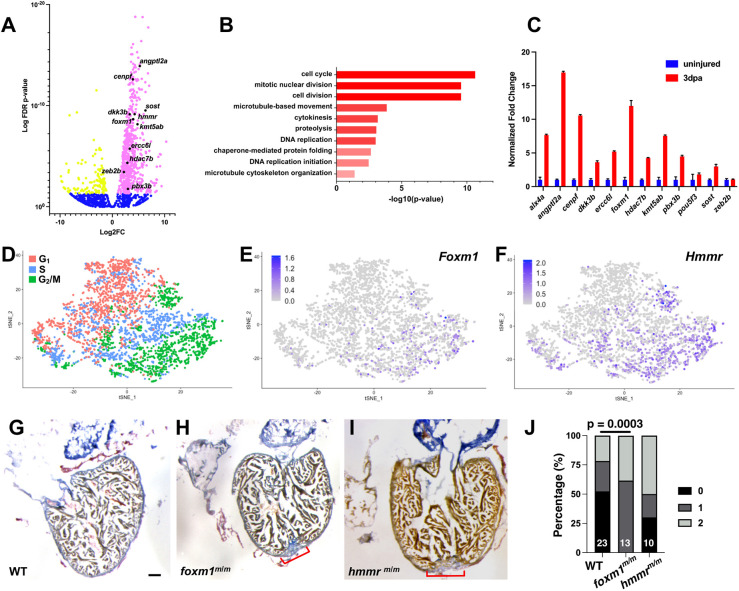
Identification of mitotic genes involved in cardiac regeneration. (A) Representative volcano plot of RNA-seq from uninjured versus 3 dpa adult ventricles. Magenta denotes genes with increased transcripts at 3 dpa, yellow represents decreased transcripts and blue represents genes with no significant change. (B) Genes with increased transcription were analyzed with FAC (DAVID) and biological processes were ranked by z-score. (C) qPCR validation was performed on candidate genes and the representative image shown depicts fold change+s.d. (D) scRNA-seq showed E10.5 embryonic left ventricular cardiomyocytes sorted by cell cycle phase. (E,F) Foxm1 (E) and Hmmr (F) were present in G2 and M phase cardiomyocytes. (G-I) Representative images from WT 30 dpa (G; n=22), foxm1m/m 30 dpa (H; n=13) and hmmrm/m 30 dpa (I; n=7) hearts stained with AFOG. AFOG staining labels fibrin (red), collagen (blue) and muscle (orange-brown). Red brackets indicate presence of fibrotic tissue. (J) Scar area was qualitatively scored: 0, no visible scar; 1, small amount of fibrosis with some collagen and fibrin stain; 2, medium to large amount of fibrosis with collagen and fibrin stain. Increased fibrotic area was noted in foxm1 mutant hearts compared with WT controls. Statistical significance was calculated using Fisher's exact test. Scale bars: 50 μm.