
Fig. 4.
- ID
- ZDB-FIG-230420-64
- Publication
- Zuppo et al., 2023 - Foxm1 regulates cardiomyocyte proliferation in adult zebrafish after cardiac injury
- Other Figures
- All Figure Page
- Back to All Figure Page
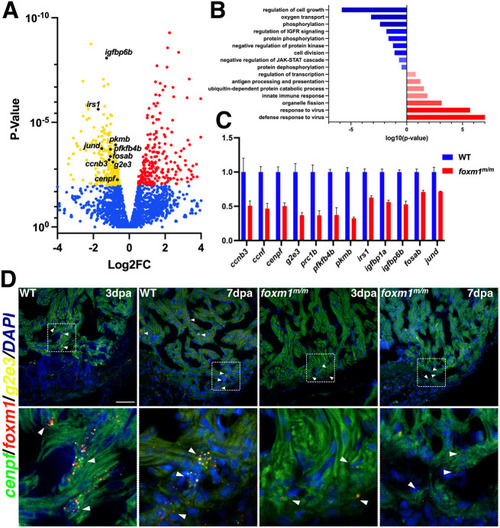
Injured foxm1m/m hearts show reduced expression of G2 and M phase cell cycle genes. (A) Representative volcano plot showing WT versus foxm1m/m 3 dpa gene expression from RNA-seq. Genes involved in cell cycle progression, insulin signaling, glycolysis and the AP-1 transcription factor family were significantly downregulated in the foxm1 mutant hearts. Red and yellow points indicate increased and decreased expression, respectively. Blue represents genes with no significant change. (B) FAC (DAVID) confirmed decreased activity of cell division and insulin signaling, whereas innate immune response is increased. (C) qPCR validation on a subset of the genes with data represented as fold change normalized to WT 3 dpa expression+s.d. (D) Fluorescence in situ hybridization of foxm1 (red) and the cell cycle genes g2e3 (yellow) and cenpf (green) show co-expression in a subset of border zone cardiomyocytes in WT 3 dpa and 7 dpa hearts, whereas foxm1+/g2e3+/cenpf+ cardiomyocytes were rarely detected in the foxm1 mutants. White arrowheads indicate representative foxm1+/g2e3+/cenpf+ cardiomyocytes within the injury border zone. Scale bar: 50 μm. |