
Fig. 5.
- ID
- ZDB-FIG-230420-65
- Publication
- Zuppo et al., 2023 - Foxm1 regulates cardiomyocyte proliferation in adult zebrafish after cardiac injury
- Other Figures
- All Figure Page
- Back to All Figure Page
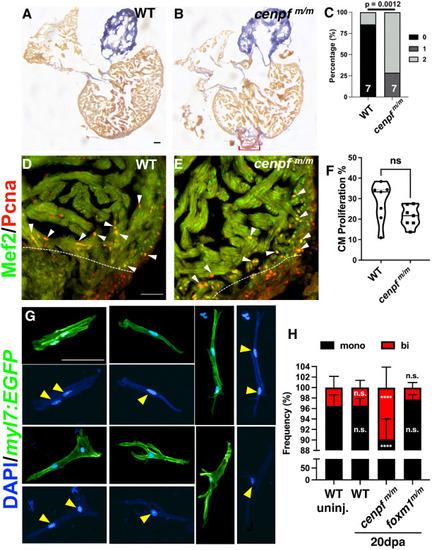
Proportion of binucleated cardiomyocytes were increased in cenpfm/m hearts. (A,B) WT (A; n=8) and cenpfm/m (B; n=8) 30 dpa hearts stained with AFOG to label fibrotic tissue. AFOG staining was used to label fibrin (red), collagen (blue) and muscle (orange-brown). Red bracket indicates fibrotic tissue. (C) Scar area was qualitatively scored: 0, no visible scar; 1, small amount of fibrosis with some collagen and fibrin stain; 2, medium to large amount of fibrosis with collagen and fibrin stain. (D-F) WT (D; n=7) and cenpfm/m (E; n=7) 7 dpa hearts showed no significant difference in cardiomyocyte proliferation index (F). White dotted lines represent the injury border and white arrowheads indicate Mef2+/Pcna+ cardiomyocytes. Truncated violin plot with each point representing an individual heart and these data represent three biological replicates. The middle line represents the median. (G,H) Individual cardiomyocytes were isolated from uninjured and 20 dpa hearts extracted from Tg(myl7:EGFP), Tg(myl7:EGFP); cenpfm/m and foxm1m/m zebrafish to count mononucleated versus binucleated cardiomyocytes. Representative images of mononucleated and binucleated cardiomyocytes are shown (G). Yellow arrowheads indicated nuclei from representative mononucleated and binucleated cardiomyocytes. The frequency (%) of WT uninjured (n=11 hearts; 1945 CMs; binucleation=3.52%), cenpfm/m uninjured (n=11; 3204 CMs; binucleation=7.24%), WT 20 dpa (n=11; 1858 CMs; binucleation=3.45%), cenpfm/m 20 dpa (n=12; 3072 CMs; binucleation=9.90%) and foxm1m/m 20 dpa (n=9; 2827 CMs; binucleation=2.28%) mononucleated (black) versus binucleated (red) cardiomyocytes was determined (H). Statistical analysis for AFOG was performed using the Fisher's exact test (C). CM proliferation index was calculated using the two-tailed, unpaired Student's t-test (F). Mononucleated versus binucleated counts used two-way ANOVA with Dunnett's multiple comparisons test (H). ****P<0.0001. n.s., not significant. Scale bars: 50 μm. |