
- Title
-
Clcf1/Crlf1a-mediated signaling is neuroprotective and required for Müller glia proliferation in the light-damaged zebrafish retina
- Authors
- Boyd, P., Campbell, L.J., Hyde, D.R.
- Source
- Full text @ Front Cell Dev Biol
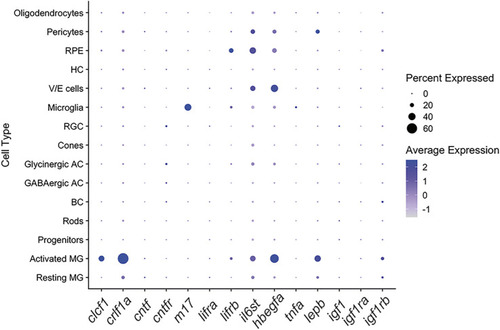
The CNTFR ligands Clcf1 and Crlf1a are expressed by Müller glia within the zebrafish retina. Dot plot showing expression of the CNTFR ligands clcf1, crlf1a and cntf, and CNTFR receptor components cntfr, lifrb and il6st in all retinal cell types in a single-cell RNA-Seq data set (Hoang et al., 2020). Expression of other pro-proliferative factors is also shown. Cells are from combined whole retina samples of 0 h, 4 h, 10 h, 20 h and 36 h of light treatment. |
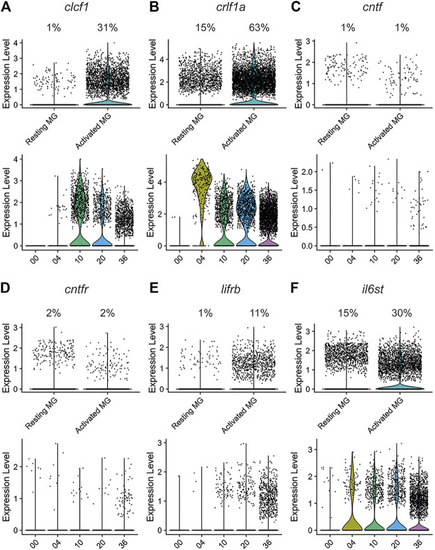
The CNTFR ligands clcf1 and crlf1a, but not cntf, are differentially expressed by activated Müller glia during regeneration in the light-treated retina. The expression of clcf1 (A), crlf1a (B), cntf (C), cntfr (D), lifrb (E), and il6st (F) were examined in a single-cell RNA-Seq data set (Hoang et al., 2020). Upper violin plots show number of UMI expressed in individual resting and activated Müller glia. Percentage of Müller glia in each cluster expressing the gene of interest is shown above the plot. Lower violin plots show number of UMI expressed across time in activated Müller glia. |
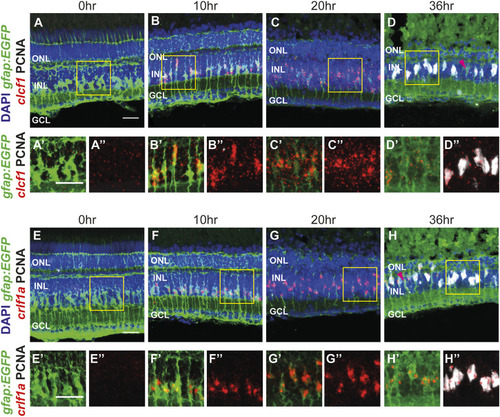
The CNTFR ligands clcf1 and crlf1a are detected within Müller glia following injury, consistent with scRNA-seq data. (A–H")Maximum projection images of dark-adapted albino; Tg[gfap:EGFP] nt11 zebrafish that were light-treated for up to 36 h, with in situ hybridization performed utilizing either clcf1 (A–D") or crlf1a (E–H") probes. Sections were also labeled for GFP and PCNA to assess proliferating Müller glia and nuclei were counterstained with DAPI. Yellow boxes in (A-H) represent areas chosen for greater magnification (in A'-H' and A"-H"). Magenta arrowheads (D, H) show resting Müller glia. ONL, outer nuclear layer, INL, inner nuclear layer, GCL, ganglion cell layer. Scale bar represents 20 µm. |
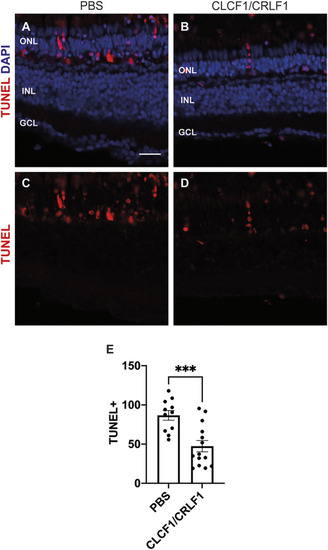
Intravitreal injection of CLCF1/CRLF1 protects against photoreceptor cell death during light treatment. (A–D) Single z-plane confocal images from dark-adapted albino zebrafish that were light-treated for 24 h while being intravitreally injected with either PBS (A, C) or CLCF1/CRLF1 (B, D). TUNEL assay was performed to assess cell death, and nuclei were counterstained with DAPI. (E) Quantification showing significant decrease in the number of TUNEL-positive nuclei within the ONL of CLCF1/CRLF1-treated retinas. Student’s t-test, p = 0.0005, n ≥ 11. Mean ± SEM, ***p < 0.001. ONL, outer nuclear layer, INL, inner nuclear layer, GCL, ganglion cell layer. Scale bar represents 20 µm. |
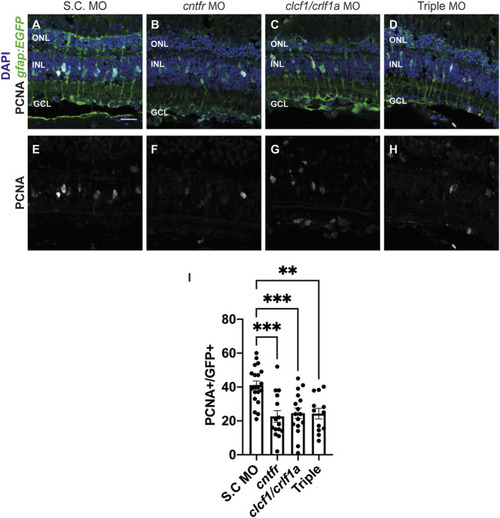
Knockdown of CNTFR and Clcf1/Crlf1a reduces Müller glia proliferation. (A–H) Single confocal images from dark-adapted albino; Tg[gfap:EGFP] nt11 zebrafish which were light-treated for 36 h after electroporation of either S.C. (A), cntfr (B), clcf1/crlf1a morpholinos (C), or a combination of all three cntfr/clcf1/crlf1a (Triple) (D). Sections were labeled for GFP and PCNA to assess proliferating Müller glia and nuclei were counterstained with DAPI (E, F, G, H). (I) Quantification showing significant decrease in the number of PCNA-positive Müller glia within the INL in cntfr and clcf1/crlf1a electroporated retinas. One-way ANOVA with Dunnett post hoc, cntfr vs. S.C. p < 0.0001, clcf1/crlf1a vs. S.C. p = 0.0003, Triple vs. S.C. p = 0.0072. n ≥ 12. Mean ± SEM, **p < 0.001, ***p < 0.001, ****p < 0.0001. ONL, outer nuclear layer, INL, inner nuclear layer, GCL, ganglion cell layer. Scale bar represents 20 µm. |
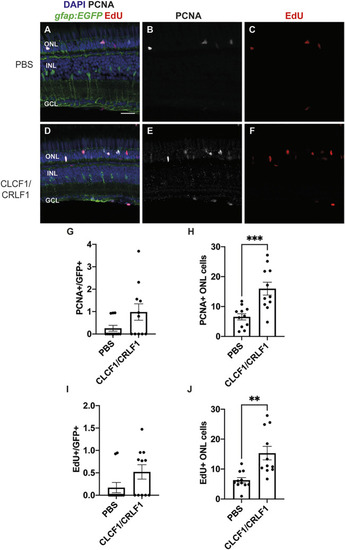
Intravitreal injection of recombinant mouse CLCF1/CRLF1 induces rod precursor cell proliferation. (A–F) Single confocal images from albino; Tg[gfap:EGFP] nt11 zebrafish which were intravitreally injected every 12 h with either PBS (A) or CLCF1/CRLF1 (D) for 72 h. Sections were labeled for GFP, PCNA, and EdU to assess proliferating Müller glia and nuclei were counterstained with DAPI (B, C, E, F). (G) Quantification showing no significant change in the number of PCNA-positive Müller glia within the INL of CLCF1/CRLF1-injected retinas. Student’s t-test, p = 0.08. (H) Quantification showing significant increase in the number of PCNA-positive cells within the ONL of CLCF1/CRLF1-injected retinas. Student’s t-test, p = 0.0008. (I) Quantification showing no significant difference in the number of EdU-positive Müller glia within the INL of CLCF1/CRLF1-injected retinas. Student’s t-test, p = 0.09. (J) Quantification showing significant increase in the number of EdU-positive cells within the ONL of CLCF1/CRLF1-injected retinas. Student’s t-test, p = 0.0014. n ≥ 11. Mean ± SEM, **p < 0.01, ***p < 0.001. ONL, outer nuclear layer, INL, inner nuclear layer, GCL, ganglion cell layer. Scale bar represents 20 µm. |
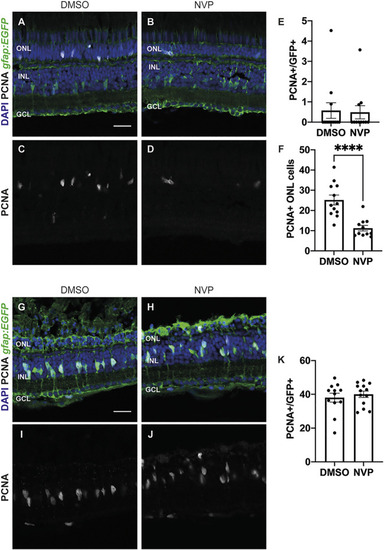
CLCF/CRLF1 induces rod precursor cell proliferation in an IGF-1R dependent manner. (A–D) Single confocal images from albino; Tg[gfap:EGFP] nt11 zebrafish which were intravitreally injected every 12 h with CLCF1/CRLF1 and simultaneously receiving injections of either DMSO (vehicle) (A) or the IGF-1R inhibitor NVP (B) for 72 h. Sections were labeled for GFP and PCNA to assess proliferating Müller glia and nuclei were counterstained with DAPI (C, D). (E) Quantification showing no significant change in the number of PCNA-positive Müller glia within the INL of NVP-treated fish. Student’s t-test, p = 0.87, n ≥ 11. (F) Quantification showing significant decrease in the number of PCNA-positive cells within the ONL of NVP-treated fish. Student’s t-test, p = 0.0001, n ≥ 11. (G–J) Single confocal images from dark-adapted albino; Tg[gfap:EGFP] nt11 zebrafish which were light-treated for 36 h while receiving injections of either DMSO (vehicle) (G) or the IGF-1R inhibitor NVP (H). Sections were labeled for GFP and PCNA to assess proliferating Müller glia and nuclei were counterstained with DAPI (I, J). (K) Quantification showing no significant change in the number of PCNA-positive Müller glia between DMSO and NVP-treated fish. Student’s t-test, p = 0.54, n ≥ 12. Mean ± SEM, ****p < 0.0001. ONL, outer nuclear layer, INL, inner nuclear layer, GCL, ganglion cell layer. Scale bar represents 20 µm. |
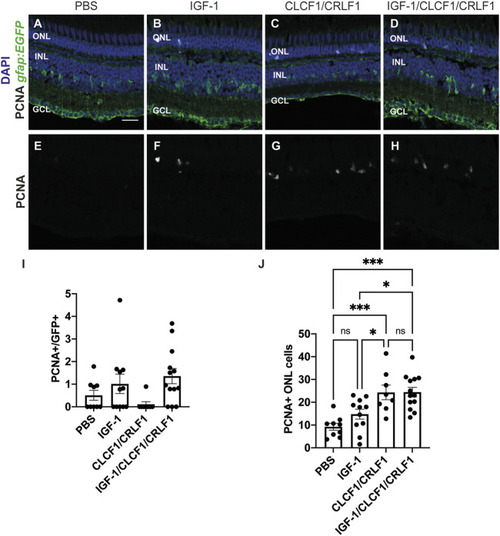
Co-injection of CLCF/CRLF and IGF-1 does not induce additional proliferation. (A–D) Single confocal images from albino; Tg[gfap:EGFP] nt11 zebrafish which were intravitreally injected every 12 h with either PBS (A), IGF-1 (B), CLCF1/CRLF1 (C), or a combination of IGF-1 and Clcf1/Crlf1a (D) for 72 h. Sections were labeled for GFP and PCNA to assess proliferating Müller glia and nuclei were counterstained with DAPI (E, F, G, H). (I) Quantification showing no change in the number of PCNA-positive Müller glia within the INL of IGF-1 and IGF-1/CLCF1/CRLF1-injected retinas. (J) Quantification showing significant difference in the number of PCNA-positive cells within the ONL of IGF-1 and IGF-1/CLCF1/CRLF1-injected retinas. One-way ANOVA with Tukey post hoc, IGF-1/CLCF1/CRLF1 vs. PBS p = 0.0001, CLCF1/CRLF1 vs. PBS p = 0.0007, IGF-1 vs. CLCF1/CRLF1 p = 0.0362, IGF-1/CLCF1/CRLF1 vs. IGF-1 p = 0.0127. n ≥ 8. Mean ± SEM, *p < 0.05,***p < 0.001. ONL, outer nuclear layer, INL, inner nuclear layer, GCL, ganglion cell layer. Scale bar represents 20 µm. |