
|
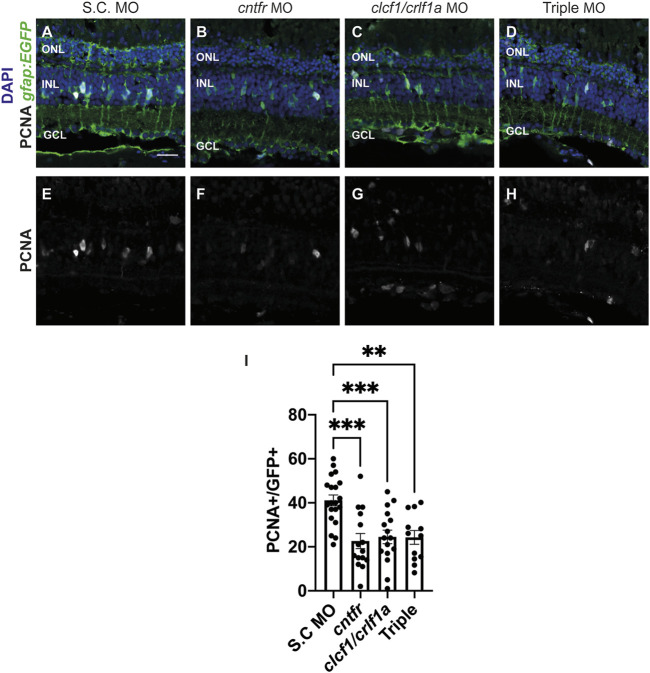
FIGURE 5
Knockdown of CNTFR and Clcf1/Crlf1a reduces Müller glia proliferation. (A–H) Single confocal images from dark-adapted albino; Tg[gfap:EGFP] nt11 zebrafish which were light-treated for 36 h after electroporation of either S.C. (A), cntfr (B), clcf1/crlf1a morpholinos (C), or a combination of all three cntfr/clcf1/crlf1a (Triple) (D). Sections were labeled for GFP and PCNA to assess proliferating Müller glia and nuclei were counterstained with DAPI (E, F, G, H). (I) Quantification showing significant decrease in the number of PCNA-positive Müller glia within the INL in cntfr and clcf1/crlf1a electroporated retinas. One-way ANOVA with Dunnett post hoc, cntfr vs. S.C. p < 0.0001, clcf1/crlf1a vs. S.C. p = 0.0003, Triple vs. S.C. p = 0.0072. n ≥ 12. Mean ± SEM, **p < 0.001, ***p < 0.001, ****p < 0.0001. ONL, outer nuclear layer, INL, inner nuclear layer, GCL, ganglion cell layer. Scale bar represents 20 µm.