
- Title
-
Multi-omics analysis reveals Mn exposure affects ferroptosis pathway in zebrafish brain
- Authors
- Zhang, S., Wu, L., Zhang, J., Wang, X., Yang, X., Xin, Y., Chen, L., Li, J., Niu, P.
- Source
- Full text @ Ecotoxicol. Environ. Saf.
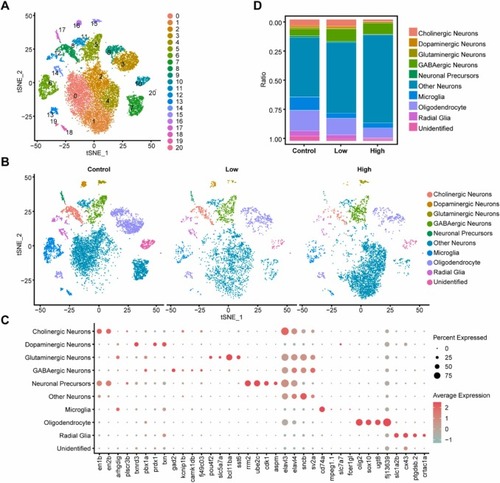
Fig. 1. Single-cell atlas of the zebrafish brain. (A) Clusters identified by graph-based clustering of isolated single cells. (B) Cell composition and distribution in different Mn exposure groups, visualized by tSNE, colored by major cell type. (C) Expression of marker genes in cell types. (D) Proportions of cell types in the control group (control), low-exposure group (low), and high-exposure group (high). |
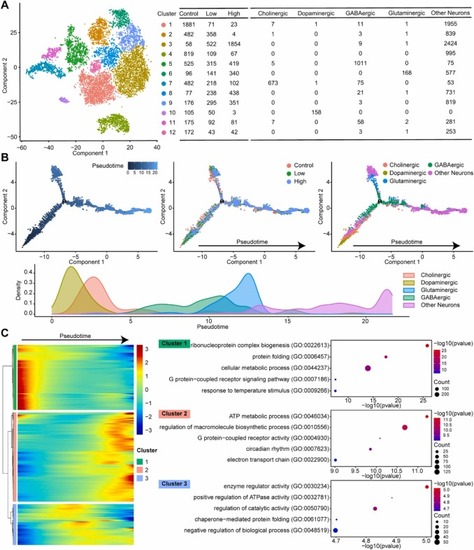
Fig. 2. Clustering and pseudotime trajectories to identify transcriptional dynamics of neuronal cells in the zebrafish brain. (A) Twelve subclusters were identified by graph-based clustering of neuronal cells in the zebrafish brain. (B) Pseudotime single-cell trajectory of neuronal cells. Pseudotime was indicated by color in a gradient from dark to light blue, and the start of pseudotime was denoted. (C) Gene expression dynamics for significant marker genes in pseudotime heatmap. Genes (rows) were clustered into three modules, and cells (columns) were ordered according to pseudotime. |
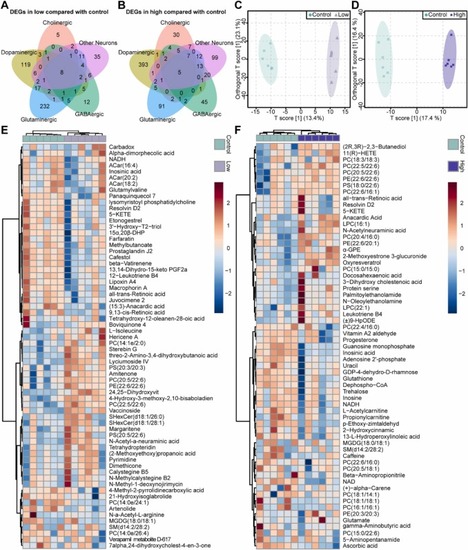
Fig. 3. Transcription and metabolic reprogramming of zebrafish brain after Mn exposure. Venn diagram based on the number of DEGs in each type of neuron in the low-exposure group (A) and high-exposure group (B) compared to the control. Metabolic profiles of the zebrafish brain in the low-exposure group (C) and high-exposure group (D) compared to the control using the OPLS-DA model. Heatmaps of peak intensities of measured DEMs, and unsupervised clusters of 66 and 63 DEMs after low (E) and high (F) Mn exposure, respectively. |
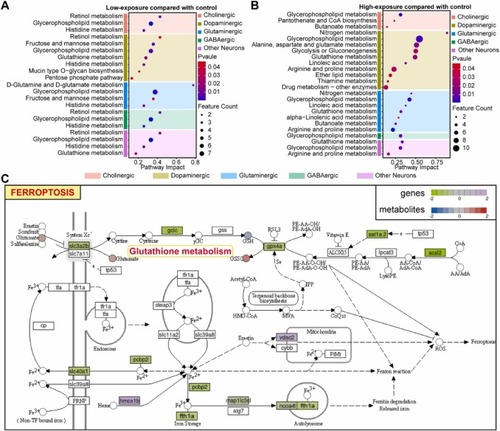
Fig. 4. Multi-omics joint analysis of Mn disrupted ferroptosis signaling pathway of neurons in the zebrafish brain. Joint metabolic pathways analysis of DEGs and DEMs in the low-exposure group (A) and high-exposure group (B). (C) The ferroptosis pathways of zebrafish dopaminergic neurons in the high-exposure group after Mn exposure. |