
Image
|
Figure Caption
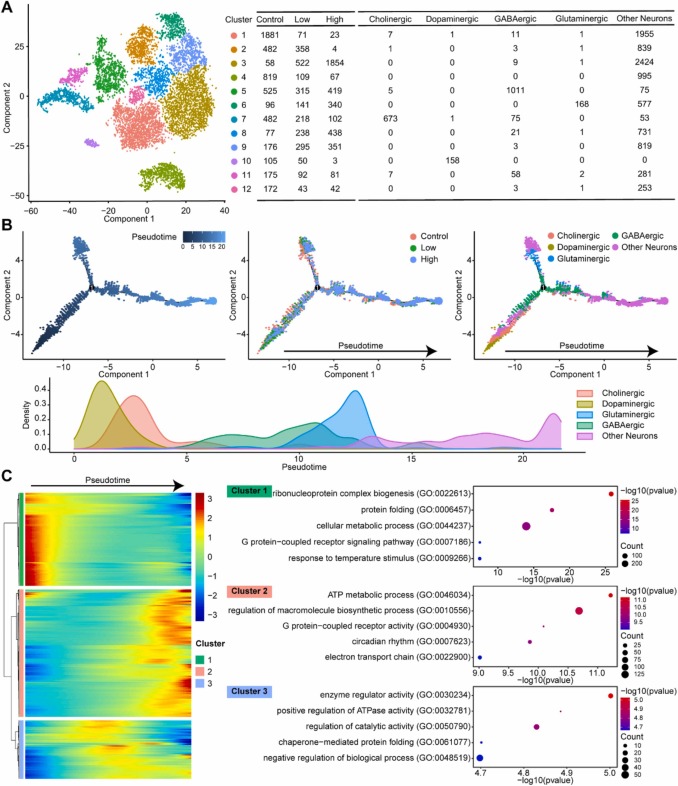
Fig. 2 Fig. 2. Clustering and pseudotime trajectories to identify transcriptional dynamics of neuronal cells in the zebrafish brain. (A) Twelve subclusters were identified by graph-based clustering of neuronal cells in the zebrafish brain. (B) Pseudotime single-cell trajectory of neuronal cells. Pseudotime was indicated by color in a gradient from dark to light blue, and the start of pseudotime was denoted. (C) Gene expression dynamics for significant marker genes in pseudotime heatmap. Genes (rows) were clustered into three modules, and cells (columns) were ordered according to pseudotime.
Acknowledgments
This image is the copyrighted work of the attributed author or publisher, and
ZFIN has permission only to display this image to its users.
Additional permissions should be obtained from the applicable author or publisher of the image.
Full text @ Ecotoxicol. Environ. Saf.