
FIGURE
Fig. 3
- ID
- ZDB-FIG-230810-16
- Publication
- Zhang et al., 2023 - Multi-omics analysis reveals Mn exposure affects ferroptosis pathway in zebrafish brain
- Other Figures
- All Figure Page
- Back to All Figure Page
Fig. 3
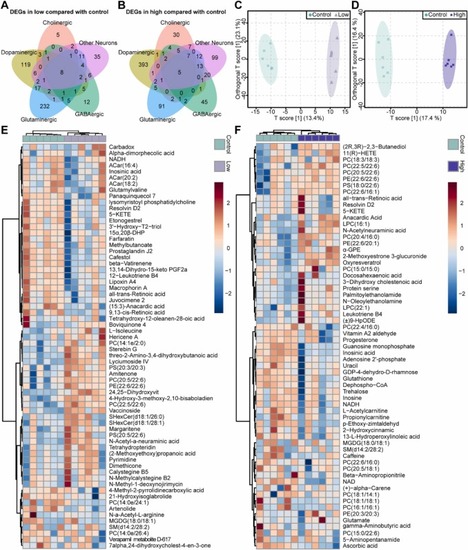
Fig. 3. Transcription and metabolic reprogramming of zebrafish brain after Mn exposure. Venn diagram based on the number of DEGs in each type of neuron in the low-exposure group (A) and high-exposure group (B) compared to the control. Metabolic profiles of the zebrafish brain in the low-exposure group (C) and high-exposure group (D) compared to the control using the OPLS-DA model. Heatmaps of peak intensities of measured DEMs, and unsupervised clusters of 66 and 63 DEMs after low (E) and high (F) Mn exposure, respectively. |
Expression Data
Expression Detail
Antibody Labeling
Phenotype Data
Phenotype Detail
Acknowledgments
This image is the copyrighted work of the attributed author or publisher, and
ZFIN has permission only to display this image to its users.
Additional permissions should be obtained from the applicable author or publisher of the image.
Full text @ Ecotoxicol. Environ. Saf.