
FIGURE
Fig. 1
- ID
- ZDB-FIG-230810-14
- Publication
- Zhang et al., 2023 - Multi-omics analysis reveals Mn exposure affects ferroptosis pathway in zebrafish brain
- Other Figures
- All Figure Page
- Back to All Figure Page
Fig. 1
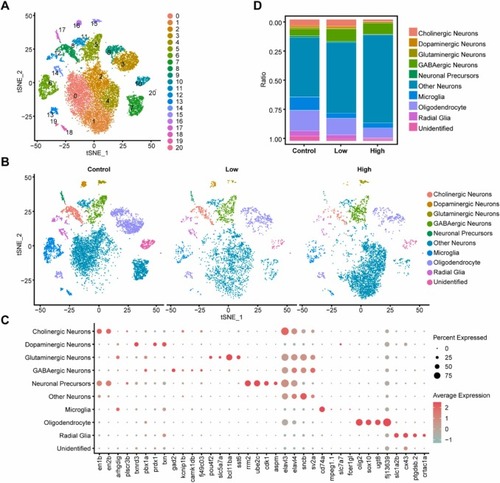
Fig. 1. Single-cell atlas of the zebrafish brain. (A) Clusters identified by graph-based clustering of isolated single cells. (B) Cell composition and distribution in different Mn exposure groups, visualized by tSNE, colored by major cell type. (C) Expression of marker genes in cell types. (D) Proportions of cell types in the control group (control), low-exposure group (low), and high-exposure group (high). |
Expression Data
Expression Detail
Antibody Labeling
Phenotype Data
Phenotype Detail
Acknowledgments
This image is the copyrighted work of the attributed author or publisher, and
ZFIN has permission only to display this image to its users.
Additional permissions should be obtained from the applicable author or publisher of the image.
Full text @ Ecotoxicol. Environ. Saf.