
- Title
-
Improved selection of zebrafish CRISPR editing by early next-generation sequencing based genotyping
- Authors
- Sieliwonczyk, E., Vandendriessche, B., Claes, C., Mayeur, E., Alaerts, M., Holmgren, P., Canter Cremers, T., Snyders, D., Loeys, B., Schepers, D.
- Source
- Full text @ Sci. Rep.
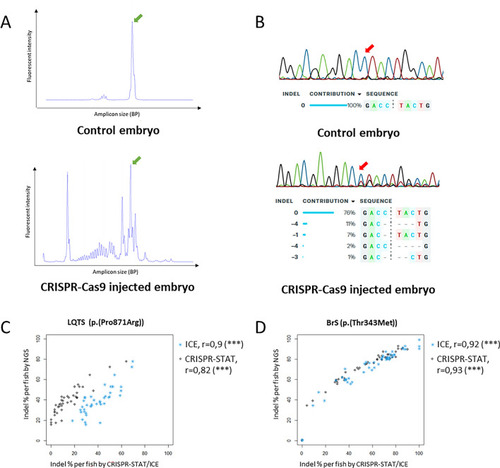
Comparison of indel detection methods. (A) Representative traces for CRISPR-STAT, top: sample from uninjected control embryo, bottom: sample from embryo injected with CRISPR-Cas9 components, green arrow: peak from wildtype amplicon, all other peaks in injected embryo represent different indel events. (B) Representative Sanger chromatograms and ICE analysis results, top: sample from uninjected control embryo, bottom: sample from embryo injected with CRISPR-Cas9 components, the trace from the injected embryo shows additional peaks on the right side of the cut site (red arrow), representing different indels, which are detected by ICE. (C,D) Correlation between Inference of CRISPR Edits (ICE) (blue symbols), CRISPR-STAT (black symbols) and NGS for LQTS (C) and BrS locus (D). Each symbol represents the indel percentage calculated for the individual embryo. Indel insertions/deletions, NGS next generation sequencing, BP base pair. |
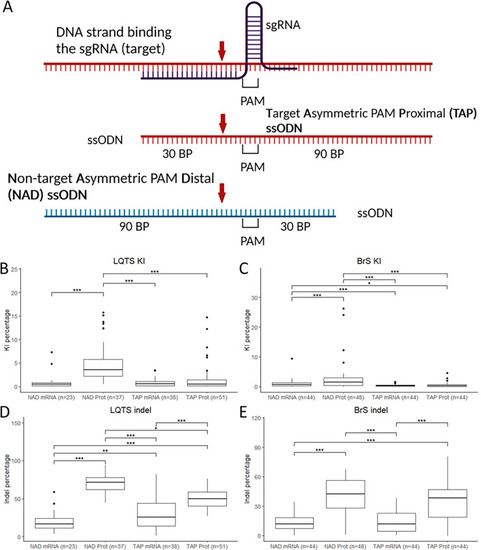
Editing efficiency with different injection components. (A) ssODN conformations used for the experiments, red arrow: CRISPR-Cas9 cut site. (B,C) KI efficiencies with the different ssODN conformations and Cas9 protein/mRNA for the LQTS locus (B) and the BrS locus (C). (D,E) Indel percentages with the different ssODN conformations and Cas9 protein/mRNA for the LQTS locus (D) and the BrS locus (E). Statistical testing was performed with negative binomial regression with use of the Tukey’s HSD (honestly significant difference) test for multiple correction, not significant results are not displayed, ***p-value < 0.001, **p-value < 0.01, *p-value < 0.05. PAM protospacer-adjacent motif, BP base pairs, NAD non-target asymmetric PAM distal, TAP target asymmetric PAM proximal, KI knock-in, indel insertion/deletion. |
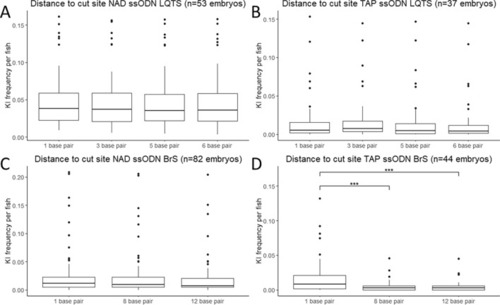
Effect of distance to the cut site on KI efficiency. (A) Frequency of KI per embryo for the non-target asymmetric PAM distal ssODN conformation for the LQTS locus (n = 37). (B) Frequency of KI per embryo for the target asymmetric PAM proximal ssODN conformation for the LQTS locus (n = 53). (C) Frequency of KI per embryo for the non-target asymmetric PAM distal ssODN conformation for the BrS locus (n = 82). (D) Frequency of KI per embryo for the target asymmetric PAM proximal ssODN conformation for the BrS locus (n = 44). Statistical testing was performed with negative binomial regression with use of the Tukey’s HSD (honestly significant difference) test for multiple correction, not significant results are not displayed, ***p-value < 0.001, **p-value < 0.01, *p-value < 0.05. KI knock-in, NAD non-target asymmetric PAM distal, TAP target asymmetric PAM proximal. |
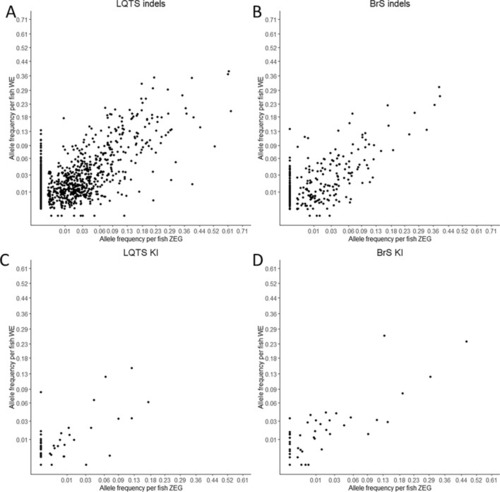
Correlation between zebrafish embryo genotyper (ZEG) and whole embryo (WE) samples. Correlation of indel (A) and knock-in (B) somatic editing frequency for the LQTS locus with square root transformation of the x- and y-axes. Correlation of indel (C) and knock-in (D) somatic editing frequencies for the BrS locus. KI knock-in, indel insertion/deletions. |
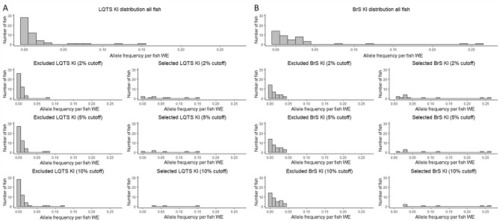
Zebrafish embryo genotyper-based knock-in selection. Histogram of distributions of KI counts of all fish (before selection) and excluded and selected fish after selection with ZEG at 2%, 5% and 10% threshold at the LQTS (n = 51) (A) and BrS (n = 43) (B) locus. WE whole embryo, KI knock-in, indel insertion/deletion. |