
Figure 1
- ID
- ZDB-FIG-230131-17
- Publication
- Sieliwonczyk et al., 2023 - Improved selection of zebrafish CRISPR editing by early next-generation sequencing based genotyping
- Other Figures
- All Figure Page
- Back to All Figure Page
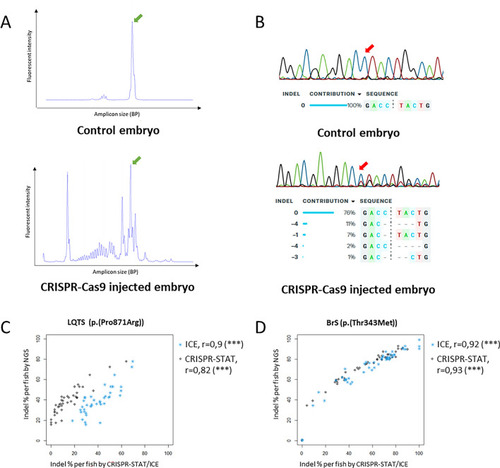
Comparison of indel detection methods. (A) Representative traces for CRISPR-STAT, top: sample from uninjected control embryo, bottom: sample from embryo injected with CRISPR-Cas9 components, green arrow: peak from wildtype amplicon, all other peaks in injected embryo represent different indel events. (B) Representative Sanger chromatograms and ICE analysis results, top: sample from uninjected control embryo, bottom: sample from embryo injected with CRISPR-Cas9 components, the trace from the injected embryo shows additional peaks on the right side of the cut site (red arrow), representing different indels, which are detected by ICE. (C,D) Correlation between Inference of CRISPR Edits (ICE) (blue symbols), CRISPR-STAT (black symbols) and NGS for LQTS (C) and BrS locus (D). Each symbol represents the indel percentage calculated for the individual embryo. Indel insertions/deletions, NGS next generation sequencing, BP base pair. |