
|
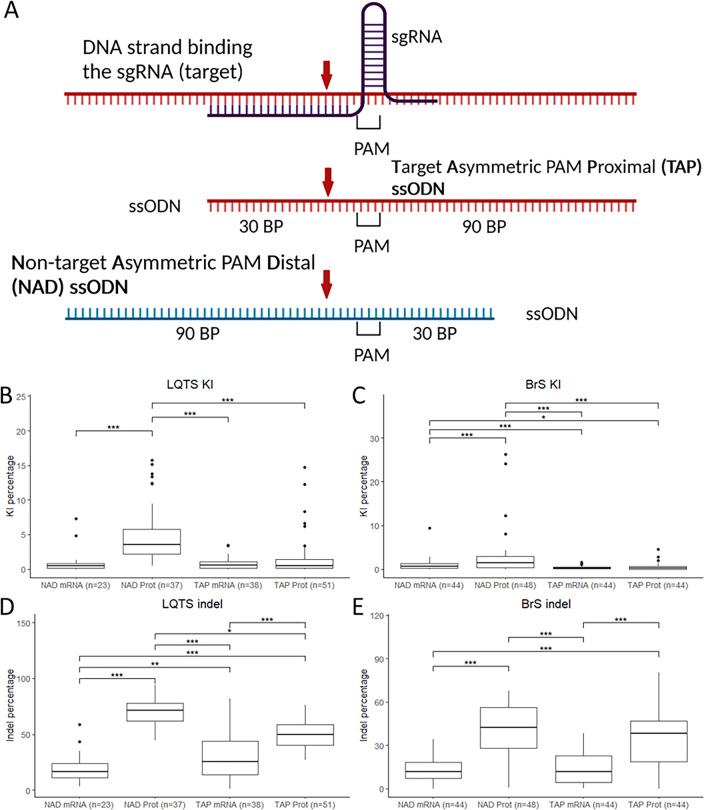
Figure 2
Editing efficiency with different injection components. (A) ssODN conformations used for the experiments, red arrow: CRISPR-Cas9 cut site. (B,C) KI efficiencies with the different ssODN conformations and Cas9 protein/mRNA for the LQTS locus (B) and the BrS locus (C). (D,E) Indel percentages with the different ssODN conformations and Cas9 protein/mRNA for the LQTS locus (D) and the BrS locus (E). Statistical testing was performed with negative binomial regression with use of the Tukey’s HSD (honestly significant difference) test for multiple correction, not significant results are not displayed, ***p-value < 0.001, **p-value < 0.01, *p-value < 0.05. PAM protospacer-adjacent motif, BP base pairs, NAD non-target asymmetric PAM distal, TAP target asymmetric PAM proximal, KI knock-in, indel insertion/deletion.