
- Title
-
Biliary epithelial cells are facultative liver stem cells during liver regeneration in adult zebrafish
- Authors
- Oderberg, I.M., Goessling, W.
- Source
- Full text @ JCI Insight
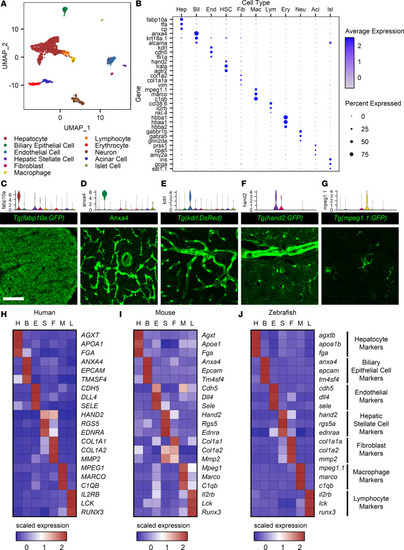
A single-cell atlas for the zebrafish liver.
(A) UMAP plot showing 11 cell type clusters identified. (B) Dot plot for the 3 key markers used in cluster identification for each cell type cluster. Gene expression is represented by log-transformed normalized UMI counts, and the average expression is the mean of expression values for all cells in a given cluster. The color key from gray to blue indicates low to high expression levels, respectively. The size key indicates the fraction of cells in an individual cluster expressing a specific gene. (C–G) Paired violin plots and immunofluorescence (green) for fabp10a (C), anxa4 (D), kdrl (E), hand2 (F), and mpeg1.1 (G). Scale bars: 50 μm. (H–J) Heatmaps displaying scaled expression for human (H), mouse (I), and zebrafish (J) orthologous genes. H, hepatocyte; B, biliary epithelial cell; E, endothelial cell; S, hepatic stellate cell; F, fibroblast; M, macrophage; and L, lymphocyte. Scaled expression values represent average expression values normalized to the minimum and maximum values in each row. The color key from blue to red indicates low to high scaled expression levels, respectively. Cell type markers are conserved across species. |
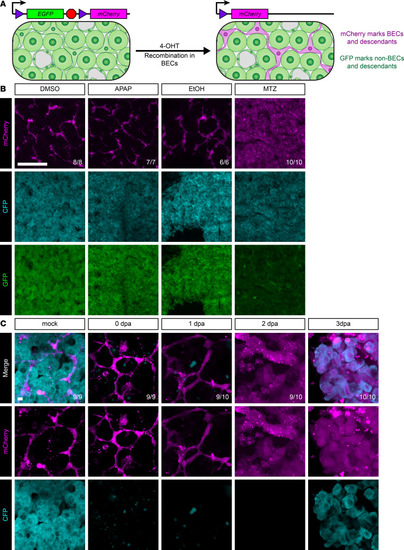
BECs give rise to hepatocytes only after hepatocyte ablation.
(A) Schematic of recombination in triple-transgenic animals. Prior to 4-OHT administration, all cells in the liver are GFP+. After 4-OHT treatment, biliary epithelial cells are mCherry+. Because these transgenes are integrated into the genome, all descendants of mCherry+ cells will also be mCherry+. (B) Immunofluorescence showing mCherry (magenta, marking biliary and biliary-derived cells), GFP (green, marking hepatocyte-derived cells), and CFP (cyan, hepatocyte identity) signal in the adult liver for animals regenerating from various insults. DMSO, vehicle control (n = 8); APAP, acetaminophen (n = 7); EtOH, ethanol (n = 6); and MTZ, metronidazole (n = 10). Only after MTZ massive hepatocyte ablation do hepatocytes appear mCherry+, indicating biliary origin. Number of animals resembling the representative image are in white in the lower right corner of each image. Scale bars: 50 μm. (C) Live imaging time course of vibratome sections showing mCherry (magenta) and CFP (cyan) signal for adult livers regenerating after MTZ-induced hepatocyte ablation. Time points include mock (n = 9), 0 dpa (n = 9), 1 dpa (n = 10), 2 dpa (n = 10), and 3 dpa (n = 10). This demonstrates clear morphological changes in cells of biliary origin starting at 1 dpa and demonstrates that hepatocytes emerge within the mCherry+ lineage at 3 dpa. Number of animals resembling the representative image are in white in the lower right corner of each image. Scale bars: 5 μm. |
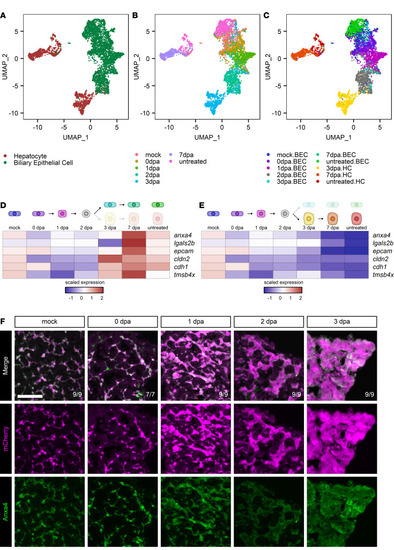
Single-cell sequencing of biliary-mediated regeneration.
(A–C) UMAP plots of hepatocytes and BECs during regeneration from hepatocyte ablation. Cells are colored by cell type (A), time point (B), and cell state (C). (D and E) Heatmaps of the average expression in selected cell states for each gene. The scaled expression values are average expression values that have been normalized to the minimum and maximum values in each row. The color key from blue to red indicates low to high scaled expression levels, respectively. Data are shown for the biliary branch (D) and hepatocyte branch (E). Biliary markers initially decrease and then only return along the biliary branch. (F) Immunofluorescence showing mCherry (magenta) and Anxa4 (green) signal as markers for BEC origin and BEC identity, respectively, in adult livers in animals regenerating from hepatocyte ablation. Time points shown are mock (n = 9), 0 dpa (n = 7), 1 dpa (n = 9), 2 dpa (n = 9), and 3 dpa (n = 9). Number of animals resembling the representative image are in white in the lower right corner of each image. Scale bars: 50 μm. |
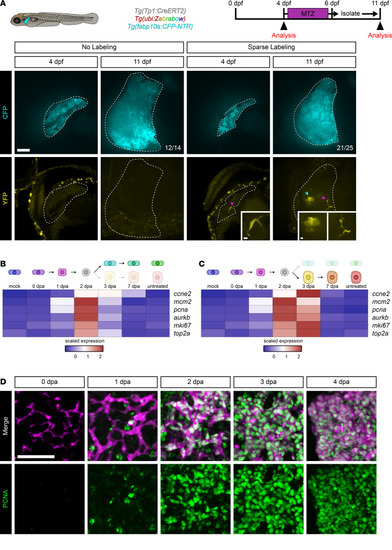
Clonal analysis of BECs during regeneration.
(A) Live images of the zebrafish larval liver showing CFP (cyan) and YFP (yellow) signal for an individual animal with either no labeling (n = 14) or sparse labeling (n = 25) before and after ablation. Number of animals resembling the representative image are in white in the lower right corner of each image. White dotted line marks the boundary of the liver. Scale bars: 50 μm. Inset scale bars: 5 μm. Magenta arrowhead marks biliary epithelial cells, and cyan arrowhead marks hepatocytes. Limiting numbers of biliary epithelial cells give rise to colonies that have both biliary epithelial cells and hepatocytes. (B and C) Heatmaps of the average expression in selected cell states for each gene. The scaled expression values are average expression values that have been normalized to the minimum and maximum values in each row. The color key from blue to red indicates low to high scaled expression levels, respectively. Data are shown for the biliary branch (B) and hepatocyte branch (C). Markers of proliferation are highest at 2 and 3 dpa. (D) Immunofluorescence in adult liver showing mCherry (magenta) and PCNA (green) for animals regenerating from hepatocyte ablation. Time points shown are 0 dpa (n = 7), 1 dpa (n = 6), 2 dpa (n = 8), 3 dpa (n = 9), and 4 dpa (n = 5). There is a burst in proliferation ranging from 1 to 4 dpa. Scale bars: 50 μm. |
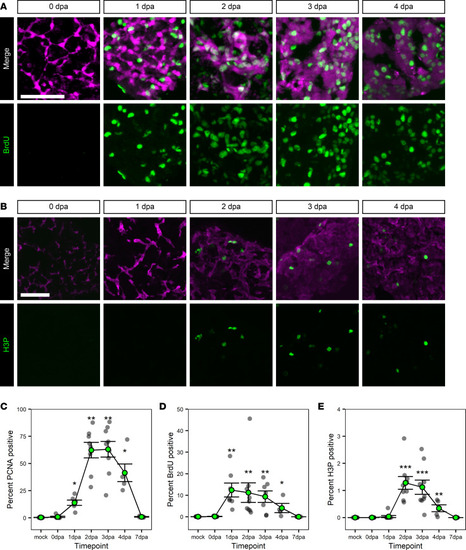
Proliferation of BECs during regeneration.
(A and B) Immunofluorescence in adult liver showing markers of biliary origin (magenta) and proliferation/cell cycling (green); mCherry (magenta) and BrdU (green) (A) or Anxa4 (magenta) and H3P (green) (B) signal for animals regenerating from hepatocyte ablation. Time points shown are BrdU: 0 dpa (n = 7), 1 dpa (n = 7), 2 dpa (n = 9), 3 dpa (n = 7), and 4 dpa (n = 4); H3P: 0 dpa (n = 9), 1 dpa (n = 9), 2 dpa (n = 9), 3 dpa (n = 9), and 4 dpa (n = 5). There is a burst in proliferation ranging from 1 to 4 dpa. Scale bars: 50 μm. (C–E) Line graph of the percentages of nuclei positive for PCNA (C), BrdU (D), or H3P (E) over time. Gray dots mark the average value for an animal; green-filled dot marks the average of the animal values. Data are shown as mean ± SEM. For PCNA and BrdU, the earliest significant change as compared with mock sample occurs at 1 dpa. For H3P, the earliest significant change is at 2 dpa. Significance was determined using the Wilcoxon Rank Sum test, and P values were adjusted for multiple hypothesis testing using a Bonferroni correction. *P < 0.05, **P < 0.01, ***P < 0.001. |

Transcription factor expression during regeneration from hepatocyte ablation.
(A) Heatmap of the average expression in selected cell states for each gene along the hepatocyte branch. The scaled expression values are average expression values that have been normalized to the minimum and maximum values in each row. The color key from blue to red indicates low to high scaled expression levels, respectively. There is an elevation of transcription factor expression at 2 dpa. (B and C) Immunofluorescence showing Anxa4 (magenta) and Prox1a (green) or Hnf4a (green) signal in adult livers of animals regenerating from hepatocyte ablation. Time points shown are Prox1a: mock (n = 7), 0 dpa (n = 9), 1 dpa (n = 8), 2 dpa (n = 8), and 3 dpa (n = 9); Hnf4a: mock (n = 8), 0 dpa (n = 6), 1 dpa (n = 7), 2 dpa (n = 6), and 3 dpa (n = 9). Prox1a signal in Anxa4+ cells is elevated from 2 to 3 dpa. Nuclear Hnf4a signal is visible in Anxa4+ cells from 2 to 3 dpa. Number of animals resembling the representative image are in white in the lower right corner of each image. Scale bars: 50 μm. |
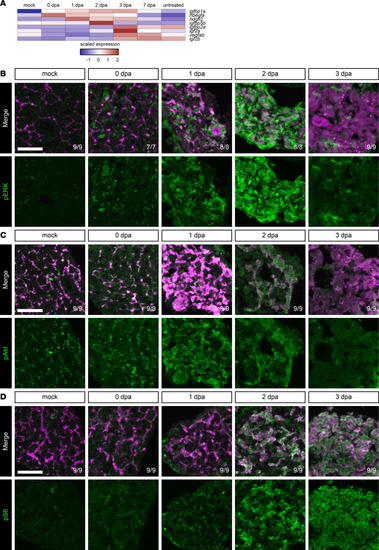
Growth factor signaling is elevated during regeneration from hepatocyte ablation.
(A) Heatmap of the average expression in selected cell states for each gene along the hepatocyte branch. The scaled expression values are average expression values that have been normalized to the minimum and maximum values in each row. The color key from blue to red indicates low to high scaled expression levels, respectively. Two of the earliest growth factors elevated are igfbp1a and hbegfa. (B–D) Immunofluorescence in adult livers showing mCherry (magenta) and pERK (green) (B), Anxa4 (magenta) and pAkt (green) (C), or Anxa4 (magenta) and pS6 (green) (D) signal for animals regenerating from hepatocyte ablation. Time points shown are pERK: mock (n = 9), 0 dpa (n = 7), 1 dpa (n = 8), 2 dpa (n = 8), and 3 dpa (n = 9); pAkt: mock (n = 9), 0 dpa (n = 9), 1 dpa (n = 9), 2 dpa (n = 9), and 3 dpa (n = 9); and pS6: mock (n = 9), 0 dpa (n = 9), 1 dpa (n = 9), 2 dpa (n = 9), and 3 dpa (n = 9). MAPK, PI3K, and mTOR signaling are active during regeneration. Number of animals resembling the representative image are in white in the lower right corner of each image. Scale bars: 50 μm. |

EGFR signaling is required for regeneration.
(A) Immunofluorescence showing mCherry (magenta) and PCNA (green) signal for regenerating animals at 3 dpa.RT after chemical treatments. Inhibition of EGFR, PI3K, and mTOR dramatically reduces both cell proliferation and changes in cell morphology. Number of animals resembling the representative image are in white in the lower right corner of each image. Scale bars: 50 μm. (B) Illustration comparing mammalian and zebrafish liver architecture and cell types. (C) Model of biliary-mediated hepatocyte regeneration and the requirement for active EGFR, PI3K, and mTOR signaling. |