
Figure 7
- ID
- ZDB-FIG-230211-149
- Publication
- Oderberg et al., 2023 - Biliary epithelial cells are facultative liver stem cells during liver regeneration in adult zebrafish
- Other Figures
- All Figure Page
- Back to All Figure Page
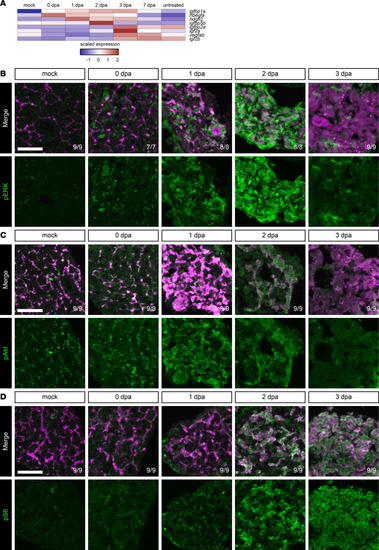
Growth factor signaling is elevated during regeneration from hepatocyte ablation.
(A) Heatmap of the average expression in selected cell states for each gene along the hepatocyte branch. The scaled expression values are average expression values that have been normalized to the minimum and maximum values in each row. The color key from blue to red indicates low to high scaled expression levels, respectively. Two of the earliest growth factors elevated are igfbp1a and hbegfa. (B–D) Immunofluorescence in adult livers showing mCherry (magenta) and pERK (green) (B), Anxa4 (magenta) and pAkt (green) (C), or Anxa4 (magenta) and pS6 (green) (D) signal for animals regenerating from hepatocyte ablation. Time points shown are pERK: mock (n = 9), 0 dpa (n = 7), 1 dpa (n = 8), 2 dpa (n = 8), and 3 dpa (n = 9); pAkt: mock (n = 9), 0 dpa (n = 9), 1 dpa (n = 9), 2 dpa (n = 9), and 3 dpa (n = 9); and pS6: mock (n = 9), 0 dpa (n = 9), 1 dpa (n = 9), 2 dpa (n = 9), and 3 dpa (n = 9). MAPK, PI3K, and mTOR signaling are active during regeneration. Number of animals resembling the representative image are in white in the lower right corner of each image. Scale bars: 50 μm. |