
Figure 4
- ID
- ZDB-FIG-230211-151
- Publication
- Oderberg et al., 2023 - Biliary epithelial cells are facultative liver stem cells during liver regeneration in adult zebrafish
- Other Figures
- All Figure Page
- Back to All Figure Page
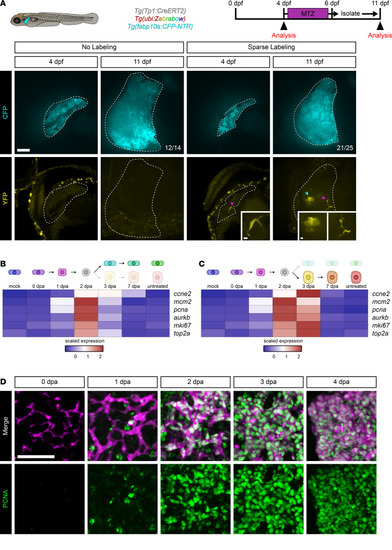
Clonal analysis of BECs during regeneration.
(A) Live images of the zebrafish larval liver showing CFP (cyan) and YFP (yellow) signal for an individual animal with either no labeling (n = 14) or sparse labeling (n = 25) before and after ablation. Number of animals resembling the representative image are in white in the lower right corner of each image. White dotted line marks the boundary of the liver. Scale bars: 50 μm. Inset scale bars: 5 μm. Magenta arrowhead marks biliary epithelial cells, and cyan arrowhead marks hepatocytes. Limiting numbers of biliary epithelial cells give rise to colonies that have both biliary epithelial cells and hepatocytes. (B and C) Heatmaps of the average expression in selected cell states for each gene. The scaled expression values are average expression values that have been normalized to the minimum and maximum values in each row. The color key from blue to red indicates low to high scaled expression levels, respectively. Data are shown for the biliary branch (B) and hepatocyte branch (C). Markers of proliferation are highest at 2 and 3 dpa. (D) Immunofluorescence in adult liver showing mCherry (magenta) and PCNA (green) for animals regenerating from hepatocyte ablation. Time points shown are 0 dpa (n = 7), 1 dpa (n = 6), 2 dpa (n = 8), 3 dpa (n = 9), and 4 dpa (n = 5). There is a burst in proliferation ranging from 1 to 4 dpa. Scale bars: 50 μm. |