
- Title
-
Identification and expression analysis of zebrafish gnaq in the hypothalamic-Pituitary-Gonadal axis
- Authors
- Wang, C., Yang, L., Xiao, T., Li, J., Liu, Q., Xiong, S.
- Source
- Full text @ Front Genet
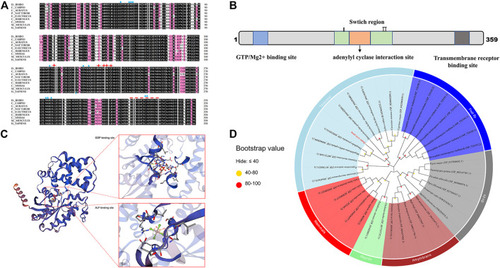
Sequence and phylogenetic analysis of gnaq. (A) Multiple sequence alignment of Gαq amino acids between zebrafish and other species. The blue triangle indicates GTP/Mg2+ binding site, red stars represent the conserved adenylyl cyclase interaction site, and the red dotted line represents transmembrane receptor binding site. Species involved in sequence alignment: (Cyprinus carpio, XP_042580939.1), (Carassius auratus, enscal00000064064), (Pygocentrus nattereri, XP_017580231.1), (Electrophorus electricus, XP_026881183.1), (Clupea harengus, XP_031433518.1), (Chelonia mydas, XP_037757737.1), (Mus musculus, NP_032165.3), (Homo sapiens, NP_002063.2). (B) Linear representation of Gαq sequence motifs and binding regions. (C) Deduced tertiary-dimensional structure of Gαq. The structure showed the GDP binding site (T.47, E.49, S.50, G.51, K.52, S.53, T.54, S.156, L.180, R.181, V.182, R.183, V.184, N.274, K.275, D.277, L.278, C.330, A.331, T.332) and ALF binding site (G.48, E.49, K.52, S.53, R.183, P.185, T.186, V.206, G.207, G.208, Q.209). (D) Phylogenetic tree based on the amino acid sequences of the known Gαq proteins from various organisms. The dot at each branch represents the bootstrap values obtained with 1,000 replicates. |

Tissue distribution of gnaq mRNA. Error bars indicate mean ± SEM (n = 3); one-way ANOVA was used for statistical analysis (p < 0.05). EXPRESSION / LABELING:
|

Expression and distribution of gnaq mRNA during embryonic development and Gαq in section of hypothalamus. (A) Relative expression of gnaq mRNA in the embryonic development stage; Error bars indicate mean ± SEM, n = 3; one-way ANOVA was used for statistical analysis (p < 0.05). (B) whole-mount in situ hybridizations of gnaq; stage: 64-cell, 30%-epiboly, 70%-epiboly, 16-somite, 21-somite, 24 h, 48 h, 72 h, and 96 h. Scale bar: 1000 μm (n = 10); (C) immunohistochemical analysis of Gαq in hypothalamus; SC: secretory cell; DIL: diffuse nucleus of the inferior hypothalamic lobe; ATN: anterior tuberal nucleus; Hc: caudal zone of periventricular hypothalamus; Hv: ventral zone of periventricular hypothalamus; Hd: dorsal zone of periventricular hypothalamus; Cpop: postoptic commissure; CM: corpus mammilare: LR: lateral recess; scale bar: 500 μm; (D) negative control; SC: secretory cell; scale bar: 500 μm. |

Immunohistochemical analysis of Gαq in ovary and testis. (A) Immunohistochemical analysis of Gαq protein in the ovary. PG: primary growth stage; PV: previtellogenic stage; EV: early vitellogenic stage; MV: midvitellogenic stage; FG: full grown stage; scale bar: 500 μm; (B) negative control; scale bar: 500 μm. (C) Immunohistochemical analysis of Gαq protein in the testis. SP: spermatogonia; PSP: primary spermatocyte; SSP: secondary spermatocyte; SPD: spermatids; scale bar: 100 μm. (D) Negative control; scale bar: 100 μm. EXPRESSION / LABELING:
|
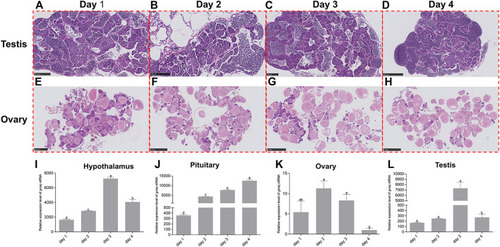
Dynamic changes of gnaq expression in HPG axis during the reproductive cycle. (A) Testis on Day 1 of the reproduction cycle; scale bar: 100μm; (B) testis on Day 2 of the reproduction cycle; scale bar: 100μm; (C) testis on Day 3 of the reproduction cycle; scale bar: 100μm; (D) testis on Day 4 of the reproduction cycle; scale bar: 250 μm; (E) ovary on Day 1 of the reproduction cycle; scale bar: 500 μm; (F) ovary on Day 2 of the reproduction cycle; scale bar: 1 nm; (G) ovary on Day 3 of the reproduction cycle; scale bar: 1 nm; (H) ovary on Day 4 of the reproduction cycle; scale bar: 1 nm; (I) expression pattern of gnaq mRNA in the hypothalamus during the reproductive cycle; (J) expression pattern of gnaq mRNA in pituitary during the reproductive cycle; (K) expression pattern of gnaq mRNA in ovary during the reproductive cycle; (L) expression pattern of gnaq mRNA in testis during the reproductive cycle. Error bars indicate mean ± SEM (n = 5); one-way ANOVA was used for statistical analysis (p < 0.05). |