
FIGURE 1
- ID
- ZDB-FIG-221211-286
- Publication
- Wang et al., 2022 - Identification and expression analysis of zebrafish gnaq in the hypothalamic-Pituitary-Gonadal axis
- Other Figures
- All Figure Page
- Back to All Figure Page
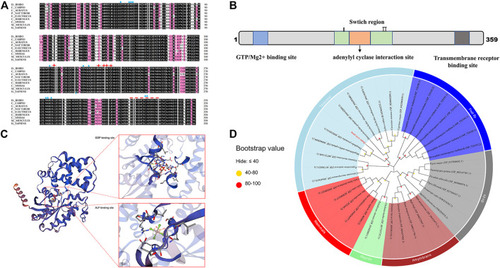
Sequence and phylogenetic analysis of gnaq. (A) Multiple sequence alignment of Gαq amino acids between zebrafish and other species. The blue triangle indicates GTP/Mg2+ binding site, red stars represent the conserved adenylyl cyclase interaction site, and the red dotted line represents transmembrane receptor binding site. Species involved in sequence alignment: (Cyprinus carpio, XP_042580939.1), (Carassius auratus, enscal00000064064), (Pygocentrus nattereri, XP_017580231.1), (Electrophorus electricus, XP_026881183.1), (Clupea harengus, XP_031433518.1), (Chelonia mydas, XP_037757737.1), (Mus musculus, NP_032165.3), (Homo sapiens, NP_002063.2). (B) Linear representation of Gαq sequence motifs and binding regions. (C) Deduced tertiary-dimensional structure of Gαq. The structure showed the GDP binding site (T.47, E.49, S.50, G.51, K.52, S.53, T.54, S.156, L.180, R.181, V.182, R.183, V.184, N.274, K.275, D.277, L.278, C.330, A.331, T.332) and ALF binding site (G.48, E.49, K.52, S.53, R.183, P.185, T.186, V.206, G.207, G.208, Q.209). (D) Phylogenetic tree based on the amino acid sequences of the known Gαq proteins from various organisms. The dot at each branch represents the bootstrap values obtained with 1,000 replicates. |