
FIGURE 5
- ID
- ZDB-FIG-221211-290
- Publication
- Wang et al., 2022 - Identification and expression analysis of zebrafish gnaq in the hypothalamic-Pituitary-Gonadal axis
- Other Figures
- All Figure Page
- Back to All Figure Page
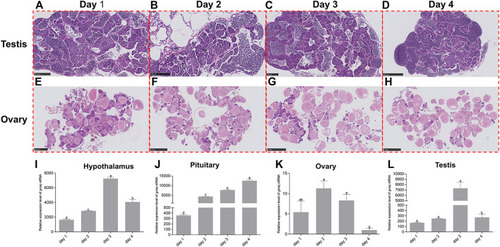
Dynamic changes of gnaq expression in HPG axis during the reproductive cycle. (A) Testis on Day 1 of the reproduction cycle; scale bar: 100μm; (B) testis on Day 2 of the reproduction cycle; scale bar: 100μm; (C) testis on Day 3 of the reproduction cycle; scale bar: 100μm; (D) testis on Day 4 of the reproduction cycle; scale bar: 250 μm; (E) ovary on Day 1 of the reproduction cycle; scale bar: 500 μm; (F) ovary on Day 2 of the reproduction cycle; scale bar: 1 nm; (G) ovary on Day 3 of the reproduction cycle; scale bar: 1 nm; (H) ovary on Day 4 of the reproduction cycle; scale bar: 1 nm; (I) expression pattern of gnaq mRNA in the hypothalamus during the reproductive cycle; (J) expression pattern of gnaq mRNA in pituitary during the reproductive cycle; (K) expression pattern of gnaq mRNA in ovary during the reproductive cycle; (L) expression pattern of gnaq mRNA in testis during the reproductive cycle. Error bars indicate mean ± SEM (n = 5); one-way ANOVA was used for statistical analysis (p < 0.05). |