FIGURE SUMMARY
Title

Zebrafish Embryos Display Characteristic Bioelectric Signals during Early Development

Authors
Silic, M.R., Dong, Z., Chen, Y., Kimbrough, A., Zhang, G.
Source
Full text @ Cells

Overall experimental procedure. (A) Illustration of a Tol2 construct, the method to produce stable ASAP1 zebrafish line, Tg (ubi: ASAP1), and zebrafish crosses. X indicates fish cross. Black arrows show fish raising or producing. The green color labels the ASAP1 transgene. (B) Experimental setup to image zebrafish Tg (ubi: ASAP1) embryos with Miltenyi Biotec light sheet ultramicroscope II. ASAP1-positive embryos were mounted in agarose on a platform to keep them stable during imaging. (C) Image analysis was performed using ImageJ (v1.53e) and Imaris programs (9.7.2, Bitplane AG).

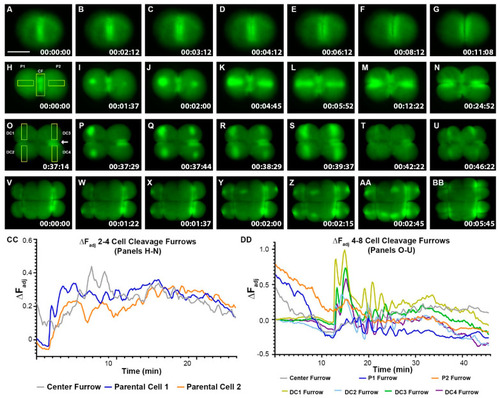
Zebrafish Cleavage period embryos display furrow-related dynamic hyperpolarization. (ABB) Still-frame representative max-projection images from time-lapse videos (Supplementary Video S1–S3). 1–16 cell stages of Tg (ubi: ASAP1) zebrafish embryos were imaged from the animal pole position. (AG) Representative Vm images from 1–2 cell stage fish embryo. (HU) Representative Vm images from 2–8 cell stage fish embryo. (VBB) Representative Vm images from an 8–16 cell stage fish embryo. Areas of bright green indicate hyperpolarization. Yellow boxes show regions of interest (ROIs) for measuring fluorescence intensity over time. The white arrow in (O) points to the P2 furrow signal. Signals appeared before cleavage furrows formed and then fluctuated as cytokinesis progressed. (CC) Adjusted fluorescence intensity, ∆FAdj, of ROIs in panels (HN). (DD) Adjusted fluorescence intensity, ∆FAdj, of ROIs in panels (OU). All lines in panels (CC,DD) represent the change in adjusted fluorescence intensity of ROIs for the designated cleavage furrows over time. CF (center furrow), a fertilized embryo’s initial division plane. P1, parental cell one. P2, parental cell two. DC1, daughter cell one. DC2, daughter cell two. DC3, daughter cell three. DC4, daughter cell four. Time (lower right corner), hours: minutes: seconds. Scale Bar= 250 µm.

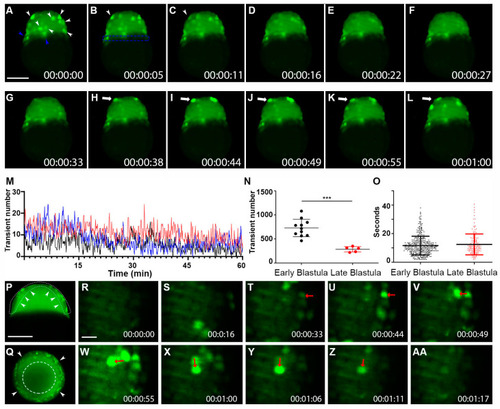
Whole-cell Vm transients occurred in the zebrafish superficial blastomeres during the blastula period. (AL) Still-frame representative max-projection images from a time-lapse video (18 min total time, 5.5-s intervals, Supplementary Video S5). Early-stage blastula of the Tg (ubi: ASAP1) zebrafish embryo was imaged from a lateral position. (A) White arrowheads indicate whole cells that were hyperpolarized. Blue arrowheads point to Vm signals in YSL. (B) The blue dashed line indicates the YSL region of cells. Arrowheads in panels (B,C) show the same cell with signal fading over time. (HL) White arrows show a cell that became hyperpolarized and eventually faded after about 20 s. (M) Average number of transients occurred at a given time point from a 60 min acquisition. The total number of hyperpolarized cells fluctuated over time. Each colored line indicates different fish embryos. (N) The total number of Vm transients occurred within the early (2.5–3.5 h) and the late (3.5–4.5 h) blastula (n ≥ 5 embryos for each group). Asterisks indicate a statistical significance of p < 0.001. (O) Vm transient duration of the early (2.5–3.5 h n = 4) and the late (3.5–4.5 h n = 3) blastula. (P) Max time projection (t = 2 min) of a 3.5 h blastula embryo imaged with a single Z-plane through the center (lateral position). Arrowheads point to the hyperpolarized cells only appearing within the superficial blastomere (Supplementary Video S6). A White dashed line indicated the EVL region of the embryo. (Q) Max time projection (t = 3 min) of a 3.5 h blastula embryo imaged with a single Z-plane through the center (animal pole position). Arrowheads point to the hyperpolarized cells only appearing within the superficial blastomere. The white segmented circle in the center of the blastula contains no hyperpolarized cells. Scale Bar= 250 µm. (RAA) Early-stage blastula embryo (3 hpf) zoomed still-frame images from a time-lapse video (1 min 17-s total time, Supplementary Video S7). Red arrows indicate whole cells that were hyperpolarized. (U) The red arrow points to a strongly hyperpolarized cell. (V) The red arrow points to an adjacent cell that signaled 5 s later. (W) The red arrow points to a new adjacent cell signaled after another 5.5 s. This pattern continued, with the arrow in panel (X) pointing to another new adjacent cell from panel (W) This pattern finally dissipated with the earlier signaling cells fading. Eventually, the last signaling cell in panel (X) faded in (AA). Time (lower right corner), hours: minutes: seconds. Scale Bar= 50 µm.

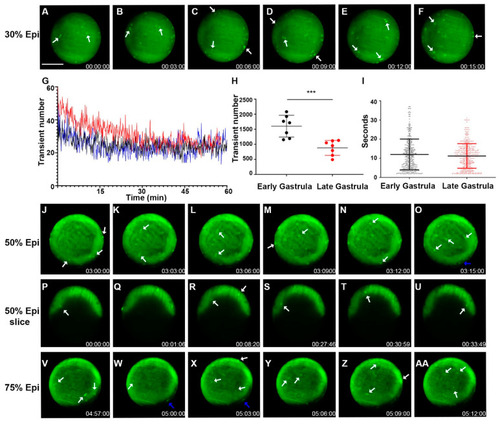
Zebrafish gastrulation exhibited whole-cell transient hyperpolarization in both superficial and deep cells. Early stage gastrula (30%) to 75% epiboly stages of the Tg (ubi: ASAP1) zebrafish embryo still-frame representative max-projection images from a time-lapse video (8 h total time, 3 min intervals, Supplementary Video S8). White arrows indicate whole cells that are hyperpolarized. (AF) Early-stage gastrula embryo (~30% epiboly, animal pole view) showed whole-cell hyperpolarization in the EVL. (G) Average number of transients occurred at a given time point from a 60 min acquisition. The total number of hyperpolarized cells fluctuates over time. Each colored line indicates different fish embryos. (H) The total number of Vm transients occurred within the early (30% epiboly to shield) and late (shield-75% epiboly) gastrula embryo (n = 7 embryos for each group). Asterisks indicate a statistical significance of p < 0.001. (I) Vm transient duration of the early and late gastrula embryos (n = 4 embryos for each group). (JO) Gastrula period embryos (50% epiboly) images from a time-lapse video (3 min intervals, Supplementary Video S8). Cell signals were seen in both the EVL (white arrows) and YSL (blue arrows). Overall signals were increased along the edge of the embryo where the embryonic shield was forming. (PU) Time-lapse images of a 50% epiboly gastrula period embryo imaged with a single Z-plane through the center (lateral position). White arrows point to the hyperpolarized cells present within the deep cells (Supplementary Video S9). (VAA) Gastrula period embryo 75% epiboly images from a time-lapse video (3 min intervals, Supplementary Video S8). Cell signals were seen in both the EVL (white arrows) and YSL (blue arrows). Overall signals were increased along the edge of the embryo where the embryonic shield was forming. Time (lower right corner), hours: minutes: seconds. Scale Bar= 250 µm.

During the segment period, more complex and dynamic cellular bioelectric signals occurred at the tissue level. (AF) Segmentation period (bud stage-6 somite stage, 1 h intervals, Supplementary Video S10). Somites and the posterior region of the embryo had an increased level of fluorescence. White arrows point to the somites. Note the relatively low fluorescent signals within the head region. (GL) Left lateral time-lapse images of 10–16 somite zebrafish embryos (Supplementary Video S11). White arrowsheads point to the strong hyperpolarization of somites. Blue arrows point to Vm signals in the developing heart. (MR) Dorsal view time-lapse images of 10–16 somite zebrafish embryos. White arrowheads indicate somite regions with strong hyperpolarization (Supplementary Video S12). (S) Embryo with positions of ROIs (1–7) used to calculate mean fluorescence and corresponding ∆FAdj. (T) ∆FAdj over time of ROIs in panel (S). All colored lines represent the change in fluorescence intensity of the designated ROI at each time point. Signals appeared to increase over time as somites became more developed. The number of fluctuations also increased as more somites were generated. (U) The mean ∆FAdj for each ROI for the entire duration of the time-lapse video. ROIs 1–2 showed the least amount of activity (most anterior somites), ROIs 3–5 showed the most activity (middle age somites), and ROIs 6–7 showed a moderate amount of activity (youngest somites/presomitic mesoderm/tailbud region). Asterisks indicate a statistical significance of p < 0.001. NS, not statistically significant. Scale Bar= 250 µm.

Summary of bioelectric signaling during zebrafish embryogenesis. Each early embryonic zebrafish developmental period has distinct yet overlapping bioelectricity signals and/or patterns. (A) The embryonic cleavage period is marked by cleavage furrow-associated Vm fluctuations that precede and persist cytokinesis. These signals become less synchronized and stable, starting around the 16-cell stage. (B) Whole-cell transient Vm signals characterize the blastula period. However, these signals are restricted to the superficial blastomere and are not seen within the deeper cells at this stage. In addition, intercellular signaling can be observed between adjacent cells. (C) The gastrulation period continues to display whole-cell transient hyperpolarization within the superficial blastomere and begins to occur within the deeper cells during epiboly. (D) Strong Vm transient signals mark the somite period. These signals can be whole or partial somites and are either unilateral or bilateral. The signals are more concentrated in the middle and posterior somites (bright green highlights hyperpolarization).

Acknowledgments
This image is the copyrighted work of the attributed author or publisher, and ZFIN has permission only to display this image to its users. Additional permissions should be obtained from the applicable author or publisher of the image. Full text @ Cells