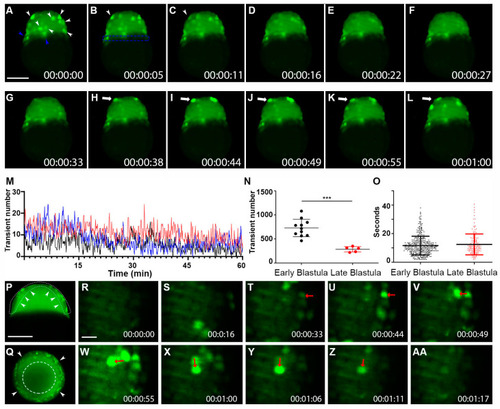
Whole-cell Vm transients occurred in the zebrafish superficial blastomeres during the blastula period. (A–L) Still-frame representative max-projection images from a time-lapse video (18 min total time, 5.5-s intervals, Supplementary Video S5). Early-stage blastula of the Tg (ubi: ASAP1) zebrafish embryo was imaged from a lateral position. (A) White arrowheads indicate whole cells that were hyperpolarized. Blue arrowheads point to Vm signals in YSL. (B) The blue dashed line indicates the YSL region of cells. Arrowheads in panels (B,C) show the same cell with signal fading over time. (H–L) White arrows show a cell that became hyperpolarized and eventually faded after about 20 s. (M) Average number of transients occurred at a given time point from a 60 min acquisition. The total number of hyperpolarized cells fluctuated over time. Each colored line indicates different fish embryos. (N) The total number of Vm transients occurred within the early (2.5–3.5 h) and the late (3.5–4.5 h) blastula (n ≥ 5 embryos for each group). Asterisks indicate a statistical significance of p < 0.001. (O) Vm transient duration of the early (2.5–3.5 h n = 4) and the late (3.5–4.5 h n = 3) blastula. (P) Max time projection (t = 2 min) of a 3.5 h blastula embryo imaged with a single Z-plane through the center (lateral position). Arrowheads point to the hyperpolarized cells only appearing within the superficial blastomere (Supplementary Video S6). A White dashed line indicated the EVL region of the embryo. (Q) Max time projection (t = 3 min) of a 3.5 h blastula embryo imaged with a single Z-plane through the center (animal pole position). Arrowheads point to the hyperpolarized cells only appearing within the superficial blastomere. The white segmented circle in the center of the blastula contains no hyperpolarized cells. Scale Bar= 250 µm. (R–AA) Early-stage blastula embryo (3 hpf) zoomed still-frame images from a time-lapse video (1 min 17-s total time, Supplementary Video S7). Red arrows indicate whole cells that were hyperpolarized. (U) The red arrow points to a strongly hyperpolarized cell. (V) The red arrow points to an adjacent cell that signaled 5 s later. (W) The red arrow points to a new adjacent cell signaled after another 5.5 s. This pattern continued, with the arrow in panel (X) pointing to another new adjacent cell from panel (W) This pattern finally dissipated with the earlier signaling cells fading. Eventually, the last signaling cell in panel (X) faded in (AA). Time (lower right corner), hours: minutes: seconds. Scale Bar= 50 µm.
|
