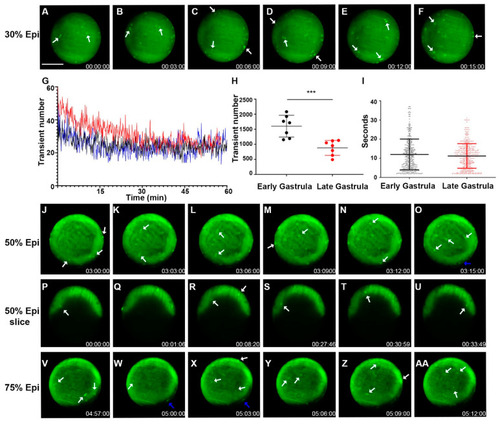
Zebrafish gastrulation exhibited whole-cell transient hyperpolarization in both superficial and deep cells. Early stage gastrula (30%) to 75% epiboly stages of the Tg (ubi: ASAP1) zebrafish embryo still-frame representative max-projection images from a time-lapse video (8 h total time, 3 min intervals, Supplementary Video S8). White arrows indicate whole cells that are hyperpolarized. (A–F) Early-stage gastrula embryo (~30% epiboly, animal pole view) showed whole-cell hyperpolarization in the EVL. (G) Average number of transients occurred at a given time point from a 60 min acquisition. The total number of hyperpolarized cells fluctuates over time. Each colored line indicates different fish embryos. (H) The total number of Vm transients occurred within the early (30% epiboly to shield) and late (shield-75% epiboly) gastrula embryo (n = 7 embryos for each group). Asterisks indicate a statistical significance of p < 0.001. (I) Vm transient duration of the early and late gastrula embryos (n = 4 embryos for each group). (J–O) Gastrula period embryos (50% epiboly) images from a time-lapse video (3 min intervals, Supplementary Video S8). Cell signals were seen in both the EVL (white arrows) and YSL (blue arrows). Overall signals were increased along the edge of the embryo where the embryonic shield was forming. (P–U) Time-lapse images of a 50% epiboly gastrula period embryo imaged with a single Z-plane through the center (lateral position). White arrows point to the hyperpolarized cells present within the deep cells (Supplementary Video S9). (V–AA) Gastrula period embryo 75% epiboly images from a time-lapse video (3 min intervals, Supplementary Video S8). Cell signals were seen in both the EVL (white arrows) and YSL (blue arrows). Overall signals were increased along the edge of the embryo where the embryonic shield was forming. Time (lower right corner), hours: minutes: seconds. Scale Bar= 250 µm.
|
