
- Title
-
RBPMS2 Is a Myocardial-Enriched Splicing Regulator Required for Cardiac Function
- Authors
- Akerberg, A.A., Trembley, M., Butty, V., Schwertner, A., Zhao, L., Beerens, M., Liu, X., Mahamdeh, M., Yuan, S., Boyer, L., MacRae, C., Nguyen, C., Pu, W.T., Burns, C.E., Burns, C.G.
- Source
- Full text @ Circ. Res.
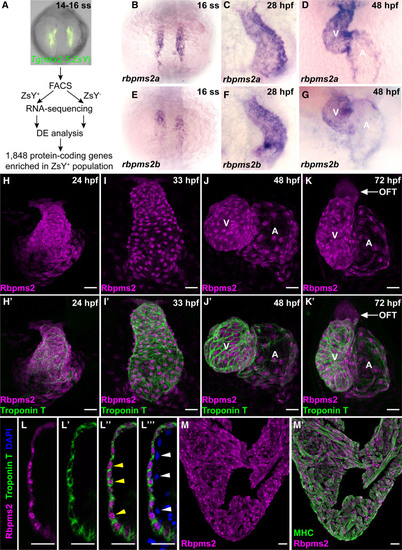
Restricted expression of RNA-binding proteins Rbpms2a (RNA-binding protein with multiple splicing [variants] 2a) and Rbpms2b to the zebrafish myocardium. A, Workflow used to identify 1848 protein-coding RNAs enriched in ZsYellow-positive (ZsY+) cardiopharyngeal progenitors or cardiomyocytes of the anterior lateral plate mesoderm in comparison to ZsYellow-negative (ZsY−) cells from the same 14–16 somites stage (ss) Tg(nkx2.5:ZsYellow) embryos. B–G, Representative brightfield images of 16 ss (B and E), 28 hours postfertilization (hpf; C and F), and 48 hpf (D,G) embryos processed for in situ hybridization with riboprobes that detect rbpms2a (B–D) or rbpms2b (E–G). n=10/group. H–K′, Representative confocal projections of hearts in 24 hpf (H and H′), 33 hpf (I and I′), 48 hpf (J and J′), and 72 hpf (K and K′) zebrafish embryos coimmunostained with antibodies that detect Rbpms2 (magenta) or cardiac troponin T (CT3 antibody; green). Single (H, I, J, and K) and merged double channel (H′, I′, J′, and K′) images are shown. n=10/group. L–L′′′, Single optical section through the ventricular wall of a 48 hpf embryo coimmunostained with antibodies that detect Rbpms2 (magenta) or cardiac troponin T (green) and counterstained with DAPI (4'‚6-diamidino-2-phenylindole; blue). Single (L and L′), merged double (L′′), and merged triple (L′′′) channel images are shown. Yellow arrowheads highlight Rbpms2-positive cardiomyocyte nuclei surrounded by troponin T–positive cytoplasm. White arrowheads highlight Rbpms2-negative nuclei in adjacent endocardial cells lining the ventricular chamber. n=4. M and M′, Representative confocal projections of a histological section through the ventricle of an adult zebrafish heart coimmunostained with antibodies that detect Rbpms2 (magenta) or MHC (myosin heavy chain; MF20 antibody; green). Single channel (M) and merged double channel (M′) images are shown. n=18 sections, 6 from each of 3 hearts. Scale bars=25 μm. A indicates atrium; DE, differential expression; FACS, fluorescence-activated cell sorting; OFT, outflow tract; and V, ventricle. |
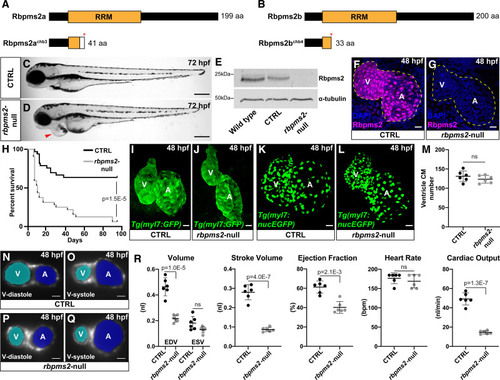
rbpms2a and rbpms2b are required redundantly for ventricular function in zebrafish. A and B, Schematic diagrams of the zebrafish Rbpms2a and Rbpms2b proteins (top) and the predicted protein products of the rbpms2achb3 and rbpms2bchb4 mutant alleles (bottom). The asterisks (*) mark the locations of premature stop codons within the RRMs (RNA-recognition motifs) caused by frame-shifting deletions. The white box in (A) shows the location of divergent amino acids before the stop codon. C and D, Representative brightfield images of control-sibling (C; CTRL) and rbpms2-null (rbpms2achb3/chb3; rbpms2bchb4/chb4; D) embryos at 72 hours postfertilization (hpf). Arrowhead highlights pericardial edema in the mutant. n=50/group. Scale bars=250μm. E, Western blot showing Rbpms2 levels in 48 hpf wild-type (WT), CTRL, and rbpms2-null embryos (top) relative to the loading control alpha-tubulin (bottom). F and G, Representative confocal projections of hearts in 48 hpf CTRL (F) and rbpms2-null (G) embryos immunostained with an anti-Rbpms2 antibody (magenta) and counterstained with DAPI (4'‚6-diamidino-2-phenylindole; blue). The dotted lines delineate the myocardium as ascertained from the Rbpms2 signal (F) or Tg(myl7:eGFP) reporter signal present in these animals (G; not shown). n=15/group. H, Kaplan-Meier plot for CTRL (n=33) and rbpms2-null (n=33) animals. Statistical significance was determined using a log-rank test. The significant P value is shown. I–L, Representative confocal projections of hearts in 48 hpf CTRL (I and K) or rbpms2-null (J and L) embryos carrying the myl7:GFP (I,J; n=10/group) or myl7:nucGFP (K and L) transgenes immunostained with an anti- GFP (green fluorescent protein) antibody. M, Dot plot showing ventricular cardiomyocyte (CM) numbers in CTRL (n=6) and rbpms2-null (n=6) hearts at 48 hpf. Error bars show one standard deviation. Statistical significance was determined by an unpaired, 2-tailed Student′s t test assuming equal variances. N–Q, Representative single-plane light sheet fluorescence microscopy images of hearts in 48 hpf CTRL (N and O) and rbpms2-null (P and Q) embryos carrying the myl7:GFP transgene. Images of hearts during ventricular diastole (N and P) or systole (O and Q) are shown with Cardiac Functional Imaging Network (CFIN) overlays of the atrial (blue) and ventricular (cyan) lumens. R, Dot plots showing end-diastolic volumes (EDV) and end-systolic volumes (ESV), stroke volumes, ejection fractions, heart rates, and cardiac outputs of ventricles in 48 hpf CTRL (n=6) and rbpms2-null (n=6) animals measured with CFIN. Error bars show one SD. Statistical significance was determined by Mann-Whitney U test or an unpaired, 2-tailed Student's t test assuming equal variances. Significant P values are shown. Scale bars=25 μm. A indicates atrium; aa, amino acid; ns, not significant; and V, ventricle. |
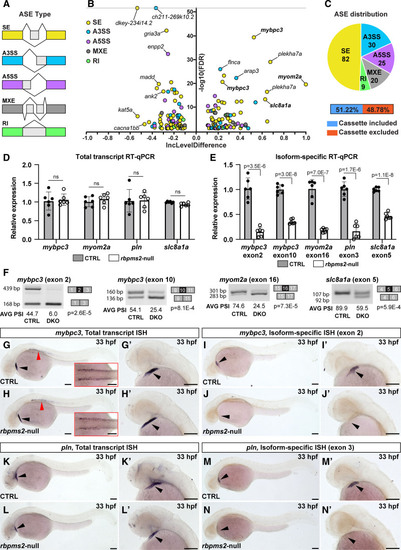
Identification of differential alternative splicing events (ASEs) in rbpms2-null embryos. A, Schematic diagrams of the categories of ASEs investigated by the RNA-sequencing Multivariate Analysis of Transcript Splicing algorithm including skipped exon (SE), alternative 3′ splice site (A3SS), alternative 5′ splice site (A5SS), mutually exclusive exon (MXE), and retained intron (RI). B, Volcano plot showing the inclusion (Inc) level differences (InclevelCTRL – Inclevelrbpms2-null) and false discovery rates (FDRs) for differential ASEs between 33 hours postfertilization (hpf) control-sibling (CTRL; n=4, 10 pooled embryos per replicate) and rbpms2-null animals (n=5) filtered by 0 uncalled replicates, FDR<0.1, and |Incleveldifference|>0.1. The ASEs shown in bold were validated with splicing-sensitive quantitative PCR (qPCR) or in situ hybridization. C. Pie chart showing the proportions of differential ASEs in each category in rbpms2-null animals. Also shown are the percentages of exons in the skipped exon category that are differentially included or excluded in rbpms2 mutants. D, Bar graph showing the relative total transcript levels in 33 hpf CTRL and rbpms2-null animals that are independent of the alternatively spliced exons. E, Bar graph showing the relative levels of isoform-specific transcripts that contain the indicated Rbpms2-regulated exons in 33 hpf CTRL and rbpms2-null animals. In D and E, single biological replicates (n=6) of 10 pooled embryos, each with 3 technical replicates are shown. Error bars show 1 SD. F, Representative gel images of semiquantitative reverse-transcription PCR (RT-PCR) amplicons and the average (AVG) percent spliced in (PSI) values for the indicated alternative splicing events in 33 hpf CTRL and rbpms2-null (double knockout [DKO]) animals. Amplicon sizes (in base pairs [bp]; left) and identities (right) are shown. n=3 biological replicates (see Figure S11), 10 pooled embryos/replicate. For D–F, Statistical significance was determined by an unpaired, 2-tailed Student's t test assuming equal variances with Bonferroni-Dunn correction for multiple comparisons (D and E). Significant P values are shown. G–N′, Representative brightfield images of 33 hpf CTRL (G, G′, I, I′, K, K′, M, and M′) and rbpms2-null (H, H′, J, J′, L, L′, N, and N′) embryos processed for in situ hybridization (ISH) with riboprobes that detect total pools (G–H′, K–L′) or specific exon-containing mRNA isoforms (I–J′, M–N′) of mybpc3 (G–J′) or pln (K–N′). The cardiac regions in (G, H, I, J, K, L, M, and N) are shown at higher zoom in (G′, H′, I′, J′, K′, L′, M′, and N′). Red arrowheads in (G and H) highlight expression of mybpc3 in skeletal muscle, which is shown from a dorsal view in the insets. n=10/group. Black arrowheads highlight the linear heart tube. Scale bars=100 μm. ns indicates not significant. |
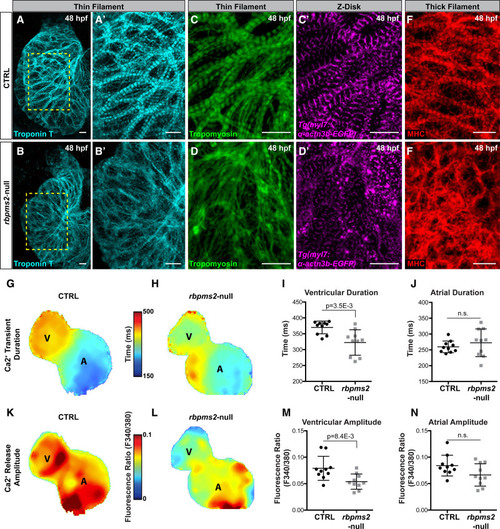
Myofibrillar disarray and calcium handling defects in rbpms2-null ventricular cardiomyocytes. A and B′, Representative confocal projections of ventricles in 48 hours postfertilization (hpf) control-sibling (CTRL) or rbpms2-null embryos immunostained with an anti-TroponinT antibody (CT3 [cardiac troponin T]) to visualize thin filaments. Regions demarcated in (A) and (B) are enlarged in (A′) and (B′). C and D′′, Confocal projections of ventricles in 48 hpf CTRL and rbpms2-null Tg(α-actn3b-EGFP) animals coimmunostained with antibodies that detect tropomyosin (CH1; green) to visualize thin filaments or GFP (magenta) to visualize Z-disks. E and F, Confocal projections of ventricles in 48 hpf CTRL and rbpms2-null embryos immunostained with an antibody that detects myosin heavy chain (MF20) to visualize thick filaments. For A–F, n=10 animals/group. Scale bars=10 μm. G–N, Color maps (G, H, K, and L) and dot plots (I, J, M, and N) of calcium transient duration (G–J) and calcium release amplitude (K–N) in the ventricle (G–I; K–M) and atrium (G, H, J, K, L, and N) of 48 hours postfertilization control-sibling (CTRL; G, I, J, K, M, and N) and rbpms2-null (H–J; L–N) hearts. Color code depicts localized calcium transient duration in milliseconds (G and H) or the ratiometric fluorescence indicator of calcium release amplitude (K and L). Each dot represents center-chamber measurements from one heart. n=10 hearts/group. Error bars show one SD. Statistical significance was determined by an unpaired, 2-tailed Student's t test assuming equal variances. Significant P values are shown. A indicates atrium; ns, not significant; and V, ventricle. |
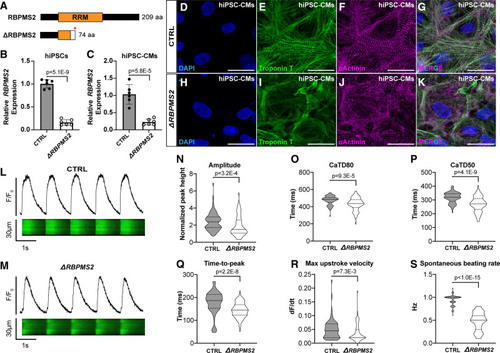
Human RBPMS2- (RNA-binding protein with multiple splicing [variants] 2)-null cardiomyocytes exhibit myofibrillar disarray and calcium handling defects similar to those in zebrafish rbpms2-null cardiomyocytes. A, Schematic diagrams of human RBPMS2 (top) and the predicted protein product of the ΔRBPMS2 null allele created with CRISPR/Cas9-mediated genome editing (bottom). The asterisk shows the location of a premature stop codon within the RRM (RNA-recognition motifs) caused by a frame-shifting 2 base pair deletion. The white box shows the location of divergent amino acids before the stop codon. B and C, Bar graphs showing the relative expression levels of RBPMS2 in wild-type control (CTRL) and ΔRBPMS2 human induced pluripotent stem cells (hiPSCs; B) and cardiomyocytes (hiPSC-CMs; C) after 15 days of directed differentiation. n=6 biological replicates/group, each with three technical replicates. Error bars show one standard deviation. Statistical significance was determined by an unpaired, 2-tailed Student's t test assuming equal variances. Significant P values are shown. D–K, Representative confocal projections of CTRL (D–G) and ΔRBPMS2 (H–K) hiPSC-CMs immunostained with antibodies that detect cardiac troponin T (CT3; green) or alpha-actinin (anti-sarcomeric alpha-actinin; magenta) to visualize thin filaments or Z-disks, respectively, and counterstained with DAPI (4'‚6-diamidino-2-phenylindole; blue). Single (D–F; H–J) and merged triple (G and K) channel images are shown. n=50 cells/group from at least 3 wells from 2 separate differentiations. L and M, Representative traces of fluorescence intensity over baseline (F/Fo; top) derived from line scans (bottom) of CTRL (L) and ΔRBPMS2 (M) hiPSC-CMs loaded with fluo-4 and paced at 1 Hz. N–S, Violin plots showing calcium transient amplitude (N), duration at 80% (CaTD80; O) and 50% (CaTD50; P) repolarization, time-to-peak amplitude (Q), upstroke velocity (R), and unpaced spontaneous beating rate (S). n=80 cells/group, 40 each from 2 separate differentiations. Statistical significance was determined by an unpaired, 2-tailed Student's t test assuming equal variances or a Mann-Whitney U test. Significant P values are shown. Scale bars=25 μm. |
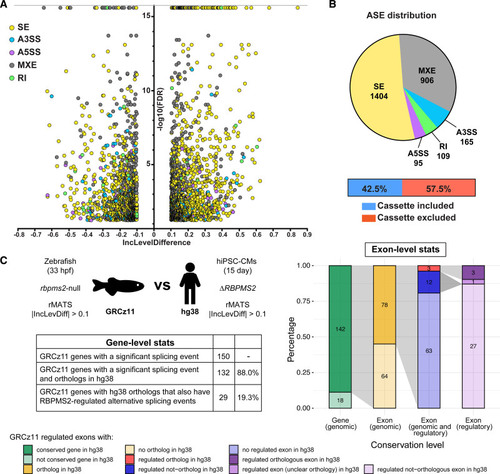
Conservation of RBPMS2 (RNA-binding protein with multiple splicing [variants] 2)-regulated splicing events in zebrafish and human induced pluripotent stem cell–derived cardiomyocytes (hiPSC-CMs). A, Volcano plot showing the inclusion (Inc) level differences (InclevelCTRL–InclevelΔRBPMS2) and false discovery rates (FDRs) for differential alternative splicing events (ASEs) between wild-type control (CTRL; n=4 from independent differentiations) and ΔRBPMS2 (n=5) filtered by 0 uncalled replicates, FDR<0.05 (capped at 10-16), and |Incleveldifference|>0.1. B, Pie chart showing the proportions of differential ASEs in each category in ΔRBPMS2 hiPSC-CMs. Also shown are the percentages of exons in the skipped exon category that are differentially included or excluded in ΔRBPMS2 hiPSC-CMs. C, Schematic diagram (left, top), table (left, bottom), and stacked bar chart (right) showing gene- and exon-level comparisons of the splicing defects in RBPMS2-deficient zebrafish (GRCz11[genome reference consortium zebrafish build 11]) and hiPSC-CMs (Hg38 [genome reference consortium human build 38]) made by ExOrthist software using the zebrafish ASEs as the query group. Of the 166 differential ASEs, 6 were in low-confidence orthologs (not shown in C, right). A3SS indicates alternative 3′ splice site; A5SS, alternative 5′ splice site; MXE, mutually exclusive exon; RI, retained intron; rMATS, replicate multivariate analysis of transcript splicing; and SE, skipped exon. |