
|
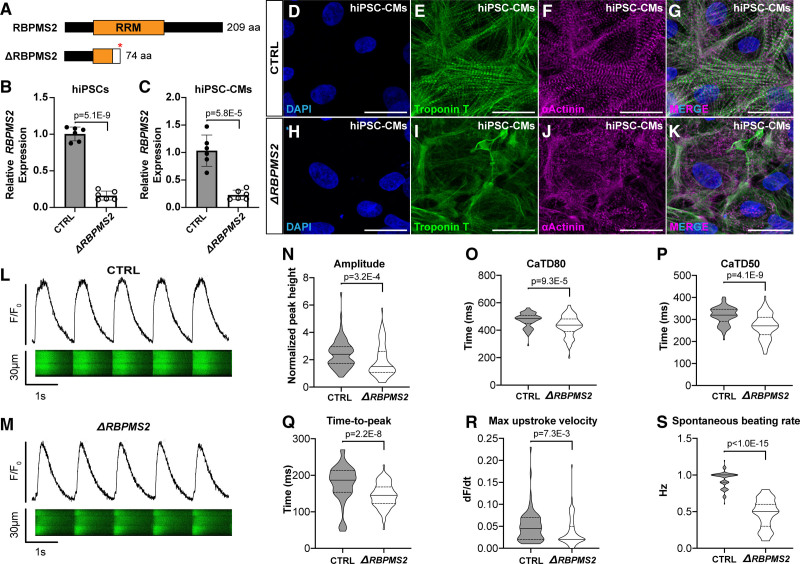
Fig. 5
Human RBPMS2- (RNA-binding protein with multiple splicing [variants] 2)-null cardiomyocytes exhibit myofibrillar disarray and calcium handling defects similar to those in zebrafish rbpms2-null cardiomyocytes. A, Schematic diagrams of human RBPMS2 (top) and the predicted protein product of the ΔRBPMS2 null allele created with CRISPR/Cas9-mediated genome editing (bottom). The asterisk shows the location of a premature stop codon within the RRM (RNA-recognition motifs) caused by a frame-shifting 2 base pair deletion. The white box shows the location of divergent amino acids before the stop codon. B and C, Bar graphs showing the relative expression levels of RBPMS2 in wild-type control (CTRL) and ΔRBPMS2 human induced pluripotent stem cells (hiPSCs; B) and cardiomyocytes (hiPSC-CMs; C) after 15 days of directed differentiation. n=6 biological replicates/group, each with three technical replicates. Error bars show one standard deviation. Statistical significance was determined by an unpaired, 2-tailed Student's t test assuming equal variances. Significant P values are shown. D–K, Representative confocal projections of CTRL (D–G) and ΔRBPMS2 (H–K) hiPSC-CMs immunostained with antibodies that detect cardiac troponin T (CT3; green) or alpha-actinin (anti-sarcomeric alpha-actinin; magenta) to visualize thin filaments or Z-disks, respectively, and counterstained with DAPI (4'‚6-diamidino-2-phenylindole; blue). Single (D–F; H–J) and merged triple (G and K) channel images are shown. n=50 cells/group from at least 3 wells from 2 separate differentiations. L and M, Representative traces of fluorescence intensity over baseline (F/Fo; top) derived from line scans (bottom) of CTRL (L) and ΔRBPMS2 (M) hiPSC-CMs loaded with fluo-4 and paced at 1 Hz. N–S, Violin plots showing calcium transient amplitude (N), duration at 80% (CaTD80; O) and 50% (CaTD50; P) repolarization, time-to-peak amplitude (Q), upstroke velocity (R), and unpaced spontaneous beating rate (S). n=80 cells/group, 40 each from 2 separate differentiations. Statistical significance was determined by an unpaired, 2-tailed Student's t test assuming equal variances or a Mann-Whitney U test. Significant P values are shown. Scale bars=25 μm.