
Fig. 3
- ID
- ZDB-IMAGE-230507-3
- Genes
- Publication
- Akerberg et al., 2022 - RBPMS2 Is a Myocardial-Enriched Splicing Regulator Required for Cardiac Function
- All Figures
- Figures for Akerberg et al., 2022
|
Fig. 3
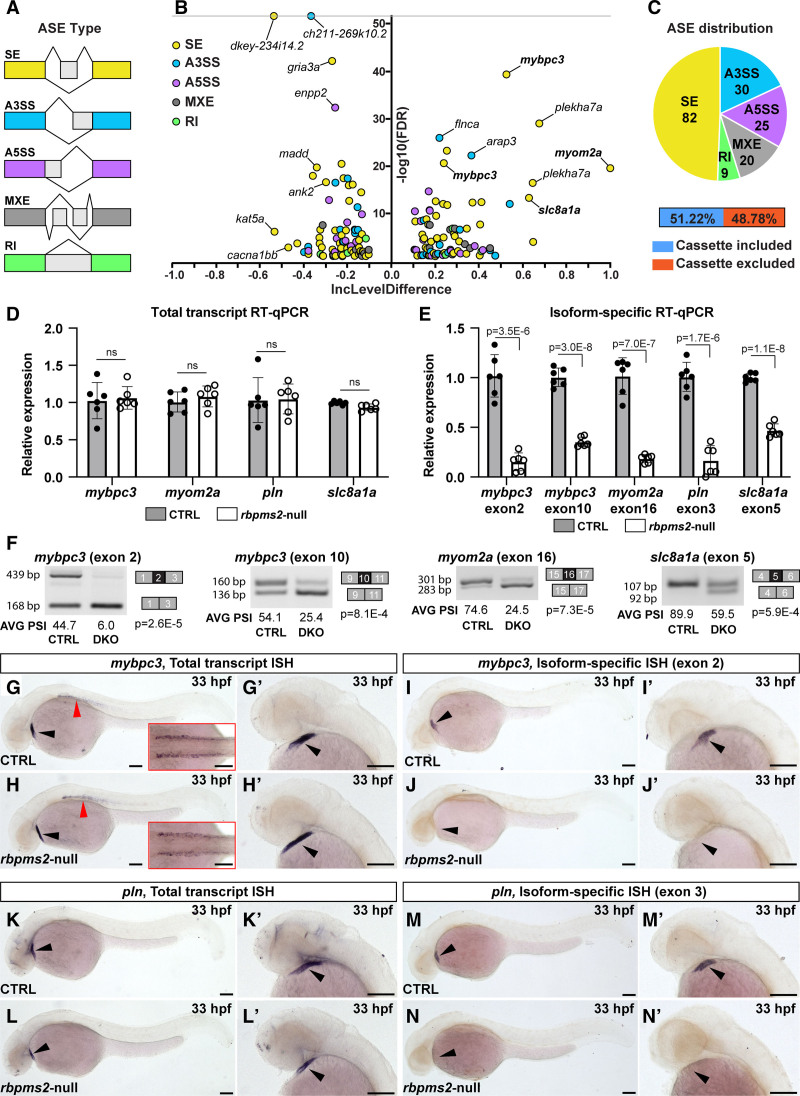
Identification of differential alternative splicing events (ASEs) in rbpms2-null embryos. A, Schematic diagrams of the categories of ASEs investigated by the RNA-sequencing Multivariate Analysis of Transcript Splicing algorithm including skipped exon (SE), alternative 3′ splice site (A3SS), alternative 5′ splice site (A5SS), mutually exclusive exon (MXE), and retained intron (RI). B, Volcano plot showing the inclusion (Inc) level differences (InclevelCTRL – Inclevelrbpms2-null) and false discovery rates (FDRs) for differential ASEs between 33 hours postfertilization (hpf) control-sibling (CTRL; n=4, 10 pooled embryos per replicate) and rbpms2-null animals (n=5) filtered by 0 uncalled replicates, FDR<0.1, and |Incleveldifference|>0.1. The ASEs shown in bold were validated with splicing-sensitive quantitative PCR (qPCR) or in situ hybridization. C. Pie chart showing the proportions of differential ASEs in each category in rbpms2-null animals. Also shown are the percentages of exons in the skipped exon category that are differentially included or excluded in rbpms2 mutants. D, Bar graph showing the relative total transcript levels in 33 hpf CTRL and rbpms2-null animals that are independent of the alternatively spliced exons. E, Bar graph showing the relative levels of isoform-specific transcripts that contain the indicated Rbpms2-regulated exons in 33 hpf CTRL and rbpms2-null animals. In D and E, single biological replicates (n=6) of 10 pooled embryos, each with 3 technical replicates are shown. Error bars show 1 SD. F, Representative gel images of semiquantitative reverse-transcription PCR (RT-PCR) amplicons and the average (AVG) percent spliced in (PSI) values for the indicated alternative splicing events in 33 hpf CTRL and rbpms2-null (double knockout [DKO]) animals. Amplicon sizes (in base pairs [bp]; left) and identities (right) are shown. n=3 biological replicates (see Figure S11), 10 pooled embryos/replicate. For D–F, Statistical significance was determined by an unpaired, 2-tailed Student's t test assuming equal variances with Bonferroni-Dunn correction for multiple comparisons (D and E). Significant P values are shown. G–N′, Representative brightfield images of 33 hpf CTRL (G, G′, I, I′, K, K′, M, and M′) and rbpms2-null (H, H′, J, J′, L, L′, N, and N′) embryos processed for in situ hybridization (ISH) with riboprobes that detect total pools (G–H′, K–L′) or specific exon-containing mRNA isoforms (I–J′, M–N′) of mybpc3 (G–J′) or pln (K–N′). The cardiac regions in (G, H, I, J, K, L, M, and N) are shown at higher zoom in (G′, H′, I′, J′, K′, L′, M′, and N′). Red arrowheads in (G and H) highlight expression of mybpc3 in skeletal muscle, which is shown from a dorsal view in the insets. n=10/group. Black arrowheads highlight the linear heart tube. Scale bars=100 μm. ns indicates not significant.