
Fig. 1
- ID
- ZDB-FIG-230507-1
- Publication
- Akerberg et al., 2022 - RBPMS2 Is a Myocardial-Enriched Splicing Regulator Required for Cardiac Function
- Other Figures
- All Figure Page
- Back to All Figure Page
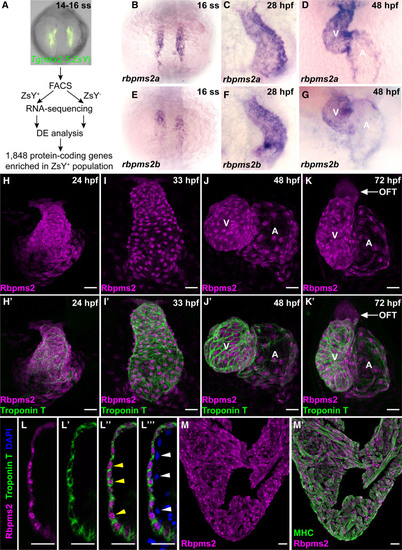
Restricted expression of RNA-binding proteins Rbpms2a (RNA-binding protein with multiple splicing [variants] 2a) and Rbpms2b to the zebrafish myocardium. A, Workflow used to identify 1848 protein-coding RNAs enriched in ZsYellow-positive (ZsY+) cardiopharyngeal progenitors or cardiomyocytes of the anterior lateral plate mesoderm in comparison to ZsYellow-negative (ZsY−) cells from the same 14–16 somites stage (ss) Tg(nkx2.5:ZsYellow) embryos. B–G, Representative brightfield images of 16 ss (B and E), 28 hours postfertilization (hpf; C and F), and 48 hpf (D,G) embryos processed for in situ hybridization with riboprobes that detect rbpms2a (B–D) or rbpms2b (E–G). n=10/group. H–K′, Representative confocal projections of hearts in 24 hpf (H and H′), 33 hpf (I and I′), 48 hpf (J and J′), and 72 hpf (K and K′) zebrafish embryos coimmunostained with antibodies that detect Rbpms2 (magenta) or cardiac troponin T (CT3 antibody; green). Single (H, I, J, and K) and merged double channel (H′, I′, J′, and K′) images are shown. n=10/group. L–L′′′, Single optical section through the ventricular wall of a 48 hpf embryo coimmunostained with antibodies that detect Rbpms2 (magenta) or cardiac troponin T (green) and counterstained with DAPI (4'‚6-diamidino-2-phenylindole; blue). Single (L and L′), merged double (L′′), and merged triple (L′′′) channel images are shown. Yellow arrowheads highlight Rbpms2-positive cardiomyocyte nuclei surrounded by troponin T–positive cytoplasm. White arrowheads highlight Rbpms2-negative nuclei in adjacent endocardial cells lining the ventricular chamber. n=4. M and M′, Representative confocal projections of a histological section through the ventricle of an adult zebrafish heart coimmunostained with antibodies that detect Rbpms2 (magenta) or MHC (myosin heavy chain; MF20 antibody; green). Single channel (M) and merged double channel (M′) images are shown. n=18 sections, 6 from each of 3 hearts. Scale bars=25 μm. A indicates atrium; DE, differential expression; FACS, fluorescence-activated cell sorting; OFT, outflow tract; and V, ventricle. |
| Genes: | |
|---|---|
| Antibodies: | |
| Fish: | |
| Anatomical Terms: | |
| Stage Range: | 14-19 somites to Adult |