
- Title
-
The Role of Histo-Blood Group Antigens and Microbiota in Human Norovirus Replication in Zebrafish Larvae
- Authors
- Cuvry, A., Gozalbo-Rovira, R., Strubbe, D., Neyts, J., de Witte, P., Rodríguez-Díaz, J., Rocha-Pereira, J.
- Source
- Full text @ Microbiol Spectr
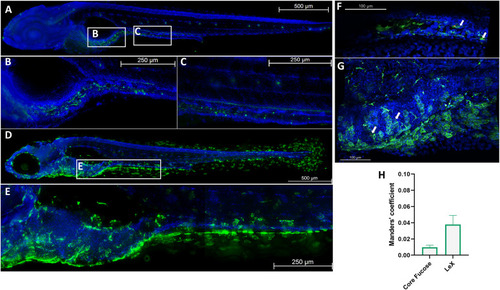
Lewis X (Lex) and core fucose are expressed in 5-days post fertilization (dpf) zebrafish larvae. (A to C) Whole-mount immunohistochemistry staining in 5 dpf larvae of core fucose stained with fluorescein isothiocyanate (FITC)-labeled A. aurantia lectin (AAL, green) and counterstained with Hoechst 33342 (blue) at ×10 (A) and ×20 (B) magnification in the intestinal bulb and ×20 magnification along the posterior intestine (C). (D, E) Whole-mount immunohistochemistry staining in 5 dpf larvae of LeX stained with anti-LeX primary antibody (green) and Hoechst 33342 (blue) at ×10 (D) and ×20 (E) magnification, representative image of LeX staining along the intestinal tract. (F, G) Whole-mount immunohistochemistry staining of human norovirus (HuNoV)-infected zebrafish larvae at ×20 magnification costained with an anti-VP1 antibody (red) and FITC-AAL (F) or LeX (G), with Hoechst 33342 as counterstaining. White arrows, colocalizing viral particles. (H) Tresholded Manders’ colocalization coefficient of HuNoV VP1 with fucose residues in the gastrointestinal tract of 5 dpf larvae (n = 5). Tresholded Manders’ coefficients are calculated with Imaris colocalization software. For panels A to E, adjacent tile pictures were merged together using the mosaic merge function of the LAS X software. |
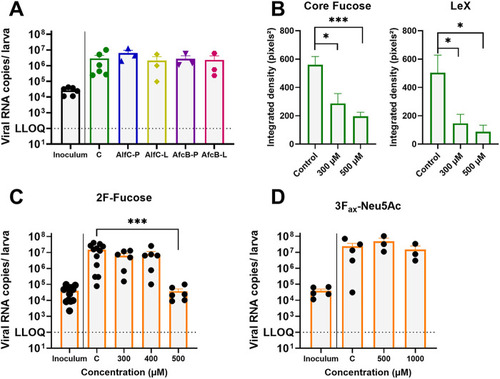
Inhibition of fucosyltransferases reduces HuNoV replication. (A) Viral RNA copies of HuNoV at 1 day postinfection (dpi). The larvae were injected with AlfC or AfcB fucosidase at 3 dpf and infected with GII.4 HuNoV at 4 dpf (n = 3-5). P, pericardial injection; L, lumen injection. (B) Fucose expression in zebrafish larvae treated with 500 μM 2F-fucose. Integrated density was quantified in a region of interest comprising the entire gastrointestinal tract with ImageJ. (C) Viral RNA copies of HuNoV per zebrafish larva at 1 dpi. The larvae were immersed in 2F-fucose from 0 to 4 dpf and infected with a GII.4 stool sample at 4 dpf (n = 6 to 12). (D) Viral RNA copies of HuNoV per zebrafish larva at 1 dpi. The larvae were immersed with 3Fax-peracetyl-Neu5Ac from 0 to 4 dpf and infected with a GII.4 stool sample at 4 dpf (n = 3 to 5). In panels A, B, and D, the bars represent viral RNA levels/zebrafish larvae, quantified by quantitative reverse transcription-PCR (RT-qPCR). The mean values ± standard error of the mean (SEM) are presented. Mann-Whitney tests were used. ***, P ≤ 0.001; **, P ≤ 0.01; *, P ≤ 0.05. The dotted line represents the lower limit of quantification (LLOQ). |
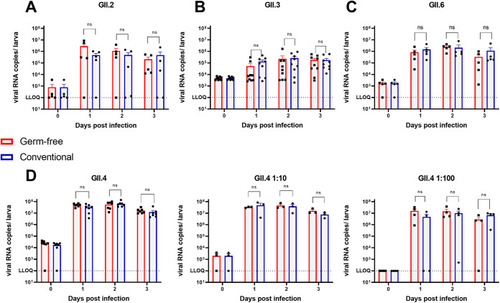
Germfree status of larvae does not affect HuNoV replication. (A to D) HuNoV replication in germfree and conventional larvae with genotypes GII.2 (A), GII.3 (B), GII.6 (C), and GII.4 (D). Calculated inocula (3 nL per zebrafish larva) are 1.5 × 10² (A), 8.2 × 10³ (B), 1.3 × 10³ (C), and 1.2 × 10⁴, 1.2 × 10³, and 1.2 × 10² (D) viral RNA copies. For all graphs, the bars represent viral RNA levels/zebrafish larva, quantified by RT-qPCR. The mean values ± SEM are presented. Mann-Whitney tests were performed. The dotted line represents the LLOQ. ns, not significant. |
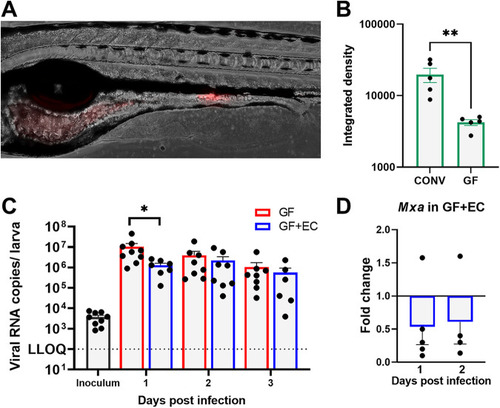
E. cloacae colonization has limited effect on HuNoV replication. (A) Representative image of E. cloacae colonization in 4 dpf larvae. Red fluorescent protein (RFP) signal produced by E. cloacae is overlaid with a brightfield image. (B) Total bacterial colonization in conventionally raised larvae (CONV) and germfree (GF) larvae represented by quantification of RFP signal. Total RFP signal in individual larvae was quantified with ImageJ. (C) Viral RNA copies of HuNoV in GF or GF + E. cloacae-colonized (EC) larvae. The larvae were colonized at 3 dpf and infected with a GII.4 HuNoV-positive stool sample at 4 dpf. The bars represent viral RNA copies/zebrafish larva, quantified by RT-qPCR. The dotted line represents the LLOQ. (D) The effect of HuNoV GII.4 replication on the expression of mxa in GF and GF+EC larvae, determined by RT-qPCR. The bars represent the relative expression of mxa in HuNoV-infected GF+EC larvae versus infected GF larvae compared to 0 dpi and normalized to the housekeeping genes (n = 5). The mean values ± SEM are presented. Mann-Whitney tests were performed to detect significant differences. *, P ≤ 0.05; **, P ≤ 0.01. |