FIGURE SUMMARY
Title

Macrophage Reprogramming with Anti-miR223-Loaded Artificial Protocells Enhances In Vivo Cancer Therapeutic Potential

Authors
López-Cuevas, P., Xu, C., Severn, C.E., Oates, T.C.L., Cross, S.J., Toye, A.M., Mann, S., Martin, P.
Source
Full text @ Adv Sci (Weinh)

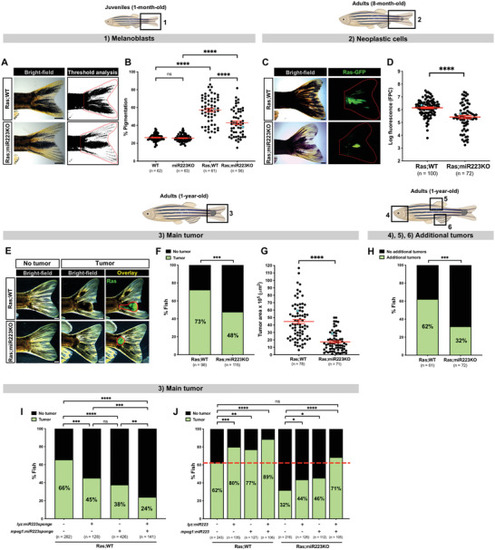
miR223 inhibition reduces cancer progression in zebrafish. A) Pigmentation of the tailfin quantified by threshold analysis of tail region (red dotted outline) in 1‐month‐old cancerous Ras;WT versus Ras;miR223KO juvenile fish. B) Dot plot showing percentage of pigmentation quantified from the regions imaged in (A) and (1). C) Ras‐GFP expression in the tail area (red dotted outline) of 8‐month‐old cancerous Ras;WT versus equivalent Ras;miR223KO adult fish. D) Dot plot showing levels of Ras‐GFP expression as quantified by fluorescent pixel count (FPC) from the regions imaged in (C) and (2). E) 1‐year‐old cancerous Ras;WT versus Ras;miR223KO adult fish bearing (or not) a tumor mass (red outline) on their tail. F) Bar chart showing percentage of cancerous fish with or without a tail tumor quantified from the regions imaged in (E) and (3). G) Dot plot showing tumor area quantified from the regions imaged in (E) and (3). H) Bar chart showing percentage of cancerous Ras;WT versus Ras;miR223KO adult fish bearing tailfin tumors, and any additional tumor (or not), quantified from the regions imaged in (4)–(6). See also Figure S1, Supporting Information. I) Bar chart showing percentage of 1‐year‐old cancerous adult fish with or without tumor, quantified from the regions imaged in (E) and (3), that are expressing miR223sponge in neutrophils (lyz:miR223sponge‐positive), macrophages (mpeg1:miR223sponge‐positive), or both lineages, in an otherwise Ras;WT background. See also Figure S2A–D, Supporting Information. J) Bar chart showing percentage of 1‐year‐old cancerous adult fish with or without tumor, quantified from the regions imaged in (E) and (3), that are overexpressing miR223 in neutrophils (lyz:miR223‐positive), macrophages (mpeg1:miR223‐positive), or both lineages, in Ras;WT or Ras;miR223KO backgrounds; red dashed line marks the percentage of control Ras;WT fish (lyz:miR223mpeg1:miR223‐double‐negative) with tumor. See also Figure S2E–H, Supporting Information. Accompanying schematics illustrate developmental stage (juvenile or adult) and imaged area (black outlined box) used for each experiment. Data are pooled from three independent experiments, and analyzed using one‐way ANOVA test with Bonferroni's multiple comparisons test (B), unpaired two‐sided Mann–Whitney test (D,G), or Fisher's exact test (F,H–J), ns p ≥ 0.05, *p < 0.05, **p < 0.01, ***p < 0.001, ****p < 0.0001. Graphs (B), (D), and (G) show mean ± SEM; each dot represents one fish and blue dots correspond to the representative images shown in the panels. n = number of fish. Scale bars = 1 mm.

Systemically injected free‐circulating protocells are taken up by leukocytes. A) Schematic representation of dextran‐containing FITC‐labeled proteinosome‐based protocells. B) Single‐channel confocal image of FITC‐protocells. C) Multi‐channel confocal image of the flank of a 2 dpf casper larva after systemic injection of FITC‐protocells at 0.5 hpi; white arrows indicate the direction of the blood flow. D) High magnification view of (C) showing FITC‐protocells moving through the caudal vein at 24 hpi; red blood cells are also imaged (asterisks). See also Figure S3 and Movies S1 and S2, Supporting Information. E) Graph showing quantification of total protocells from the regions imaged in (C). F) Multi‐channel confocal images of the flank of Tg(mpeg1:mCherry) larvae after systemic injection of FITC‐protocells at 2 dpf and imaged at 0.5, 24, and 96 hpi, showing the distribution of protocells within macrophages (white arrowheads) and free within the vasculature. See also Figure S6 and Movies S7 and S8, Supporting Information. G) Imaris 3D reconstruction from confocal movie frames showing a macrophage engulfing and internalizing a free‐circulating FITC‐protocell within the caudal artery (blue dashed box in [F]). See also Movie S3, Supporting Information. H) Multi‐channel confocal images of the flank of Tg(lyz:DsRed) larvae after systemic injection of FITC‐protocells at 2 dpf and imaged at 0.5, 24, and 96 hpi, showing the distribution of protocells within neutrophils (white arrowheads) and free within the vasculature. I) Imaris 3D reconstruction from a confocal z‐stack image showing several FITC‐protocells internalized within a neutrophil at the CHT region (magenta dashed box in [H]). Rendered 3D image is rotated to demonstrate that protocells have been fully taken up by and reside within the neutrophil. See also Movie S4, Supporting Information. J–M) Graphs showing percentage of protocells within macrophages (J) or neutrophils (L), and percentage of macrophages (K) or neutrophils (M) containing protocell(s) quantified from the regions imaged in (F) and (H). See also Figures S4 and S5, and Movies S5 and S6, Supporting Information. “High”, “medium”, and “low” correspond to the different protocell titrations injected (1.25 × 107, 5 × 106, and 2.5 × 106 protocells/µL, respectively). Accompanying schematics illustrate developmental stage (larva), type of injection (systemic), and imaged area (black outlined box) used for the experiments. Data are pooled from three independent experiments. Graphs show mean ± SEM, and each dot represents the mean of all fish analyzed. Mϕ = macrophages; n = number of fish; Nϕ = neutrophils. Scale bars = 2 µm (B), 100 µm (C,F,H), 10 µm (D), 5 µm (G,I).

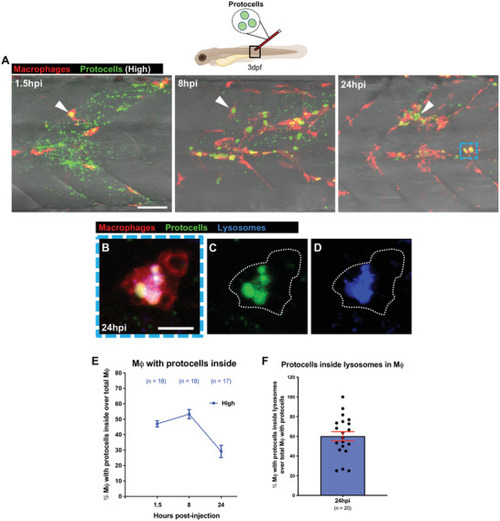
Locally injected protocells are taken up by macrophages. A) Multi‐channel confocal images of the flank of Tg(mpeg1:mCherry) larvae after local injection of FITC‐protocells at 3 dpf and imaged at 1.5, 8, and 24 hpi showing the distribution of protocells within macrophages (white arrowheads) and dispersed along the fish somite (injection site). See also Movie S9, Supporting Information. B–D) Multi‐channel (B) or single‐channel (C,D) confocal images showing the lysosomal fate of internalized FITC‐protocells within a macrophage (white dotted outlines) after local injection of protocells at 24 hpi (blue dashed box in [A]). E,F) Graphs showing percentage of macrophages containing protocell(s) (E) or with overlaying protocells and lysosomes (F) quantified from the regions imaged in (A). “High” corresponds to the protocell concentration injected (1.25 × 107 protocells/µL). Accompanying schematic illustrates developmental stage (larva), type of injection (local), and imaged area (black outlined box) used for the experiment. Data are pooled from three independent experiments. Graphs show mean ± SEM. In graph (E) each dot represents the mean of all fish analyzed, and in graph (F) each dot represents one fish. Mϕ = macrophages; n = number of fish. Scale bars = 50 µm (A), 10 µm (B).

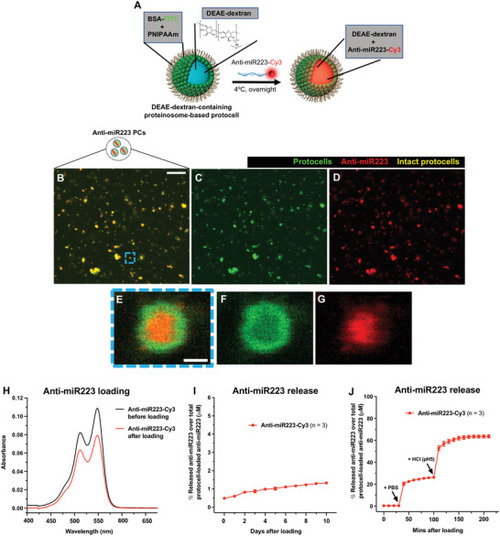
Loading strategy of anti‐miR223 into protocells. A) Schematic of the experimental design for loading DEAE‐dextran‐containing FITC‐protocells with anti‐miR223‐Cy3. B–G) Multi‐channel (B,E) or single‐channel (C,D,F,G) confocal images of FITC‐protocells after loading with anti‐miR223‐Cy3. E–G) High magnification views of (B)–(D) showing a single anti‐miR223‐Cy3 FITC‐protocell. H) Spectra showing absorbance quantification of the anti‐miR223‐Cy3 supernatant before and after protocell loading. I,J) Graphs showing percentage of anti‐miR223‐Cy3 released from loaded protocells into the supernatant over total anti‐miR223‐Cy3 concentration initially loaded into protocells, under normal conditions in H2O (I) or after exposure to PBS and HCl (J). Data are representative (H) or pooled (I,J) from three independent experiments. Graphs (I,J) show mean ± SEM, and each dot represents the mean of all experiments analyzed. n = number of experiments; PCs = protocells. Scale bars = 20 µm (B), 1 µm (E).

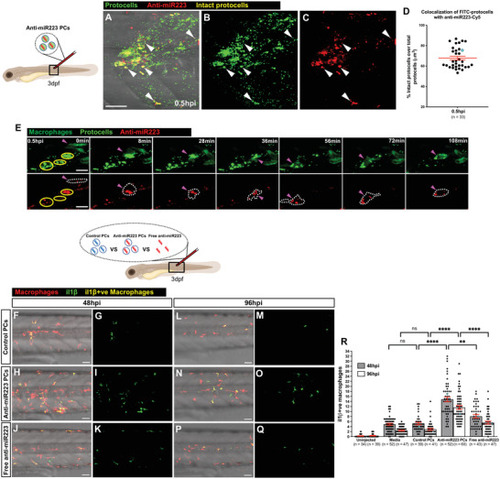
Uptake of anti‐miR223 protocells enhances il1β expression in macrophages. A–C) Multi‐channel (A) or single‐channel (B,C) confocal images of the flank of a 3 dpf casper larva after local injection of anti‐miR223‐Cy5 FITC‐protocells at 0.5 hpi; white arrowheads indicate anti‐miR223 protocells that remain intact post injection. D) Dot plot showing percentage of intact protocells as quantified by colocalization of FITC (protocells) with Cy5 (anti‐miR223) from the regions imaged in (A)–(C). E) Single‐channel confocal movie frames of a region of the flank of a 3 dpf Tg(mpeg1:FRET) larva after local injection of anti‐miR223‐Cy5 FITC‐protocells at 0.5 hpi showing the uptake of intact protocells (yellow circles) by a macrophage (magenta arrowheads and white dotted outlines). See also Movie S10, Supporting Information. F–Q) Multi‐channel (F,H,J,L,N,P) or single‐channel (G,I,K,M,O,Q) confocal images of the flank of Tg(mpeg1:mCherry;il1β:GFP) larvae showing il1β‐positive macrophages (yellow) (il1β‐negative macrophages are red) after local injection of unlabeled control protocells, unlabeled anti‐miR223 protocells or unlabeled free anti‐miR223 at 3 dpf and imaged at 48 hpi (F–K) and 96 hpi (L–Q). R) Graph showing the number of il1β‐positive macrophages following each treatment quantified from the regions imaged in (F)–(Q). See also Figures S7 and S8, Supporting Information. Accompanying schematics illustrate developmental stage (larva), type of injection (local), and imaged area (black outlined box) used for each experiment. Data are pooled from three independent experiments and analyzed using Kruskal–Wallis test with Dunn's multiple comparisons test (R), ns p ≥ 0.05, **p < 0.01, ****p < 0.0001. Graphs show mean ± SEM, each dot represents one fish and blue dots correspond to the representative images shown in the panels. n = number of fish; PCs = protocells. Scale bars = 50 µm (A,F,H,J,L,N,P), 20 µm (E).

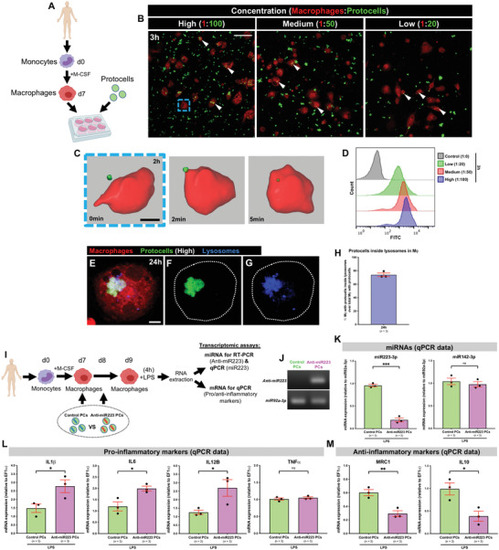
In vitro uptake of anti‐miR223 protocells by human macrophages enhances expression of pro‐inflammatory markers. A) Schematic of the experimental design; monocytes isolated from human donors undergo in vitro differentiation toward macrophages (via M‐CSF) prior to FITC‐protocell addition (day 7). B) Multi‐channel confocal images of human macrophages after incubation with different FITC‐protocell concentrations for 3 h; white arrowheads indicate protocells within macrophages. C) Imaris 3D reconstruction from confocal movie frames showing FITC‐protocell uptake by a human macrophage 2 h after protocell addition (blue dashed box in [B]). See also Movie S11, Supporting Information. D) Representative histograms from flow cytometry analysis of human macrophages treated with different FITC‐protocell concentrations for 3 h. See also Figure S10, Supporting Information. E–G) Multi‐channel (E) or single‐channel (F,G) confocal images showing the lysosomal fate of internalized FITC‐protocells within a human macrophage (white dotted outlines) 24 h after protocell addition. H) Graph showing percentage of human macrophages with overlaying protocells and lysosomes 24 h after protocell addition quantified from the regions imaged in (B). I) Schematic of the experimental timeline to evaluate human macrophage reprogramming and anti‐miR223 delivery/function (through transcriptomic analysis) after anti‐miR223 protocell treatment; FITC‐protocells, loaded with control anti‐miR or anti‐miR223, were administered to macrophage cultures in two consecutive doses (days 7 and 8) prior to LPS exposure for 4 h (day 9), and total RNA from macrophages was extracted for RT‐PCR and qPCR assays. J) RT‐PCR of miRNA extracted from human macrophages after each protocell treatment; anti‐miR223 from macrophages treated with control protocells was used as a negative control, and miR92a‐3p from macrophages of each protocell treatment as a loading control. K–M) Graphs showing qPCR data for the expression levels of miRNAs (miR223‐3p and miR142‐3p) (K), pro‐inflammatory markers (IL1β, IL6, IL12B, and TNFα) (L), and anti‐inflammatory markers (MRC1 and IL10) (M), in LPS‐stimulated human macrophages after each protocell treatment. See also Figures S11 and S12, Supporting Information. qPCR data were normalized to the indicated housekeeping genes/miRs from LPS‐stimulated macrophages that had not been treated with protocells. “High”, “medium”, and “low” correspond to the different macrophage:protocell ratios used (1:100, 1:50, and 1:20, respectively). Data are from one experiment (J), pooled from three independent experiments (H,K–M), or representative from two independent experiments (D), and analyzed using unpaired two‐sided t‐test, ns p ≥ 0.05, *p < 0.05, **p < 0.01, ***p < 0.001. Graphs show mean ± SEM, and each dot represents one experiment. Mϕ = macrophages; n = number of experiments; PCs = protocells. Scale bars = 50 µm (B), 10 µm (C), 5 µm (E).

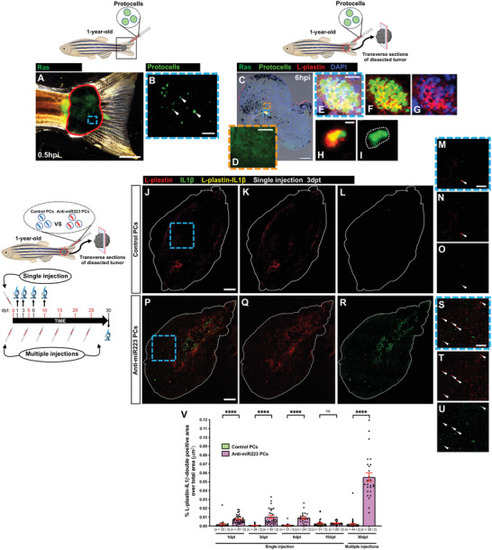
Uptake of anti‐miR223 protocells induces a leukocyte pro‐inflammatory state in adult zebrafish. A) Multi‐channel image of a 1‐year‐old adult tail tumor (red outline) locally injected with FITC‐protocells and imaged at 0.5 hpi. B) High magnification view of (A) showing a single‐channel image of FITC‐protocells (white arrowheads) at the injection site. C) Multi‐channel confocal image of an immunostained cryosection from a 1‐year‐old adult tail tumor harvested 6 h after local FITC‐protocell injection; nuclei are stained with DAPI (blue), and leukocytes are revealed by anti‐L‐plastin immunostaining (red). D) High magnification view of (C) showing single‐channel confocal image of Ras‐GFP region. E–I) High magnification views of (C) showing multi‐channel (E–H) or single‐channel (I) confocal images of FITC‐protocells within L‐plastin‐positive cells (white dotted outline in [I]). See also Figure S14, Supporting Information. J–U) Multi‐channel (J,M,P,S) or single‐channel (K,L,N,O,Q,R,T,U) confocal images of immunostained cryosections from 1‐year‐old adult tail tumors at 3 dpt after a single local injection of unlabeled control protocells (J–O) or unlabeled anti‐miR223 protocells (P–U); white lines indicate tumor margins; leukocytes are revealed by anti‐L‐plastin immunostaining (red) and IL1β revealed by anti‐IL1β immunostaining (green). (M–O,S–U) High magnification views of (J)–(L) and (P)–(R); white arrowheads indicate L‐plastin‐IL1β‐double‐positive cells (yellow). V) Graph showing percentage of L‐plastin‐IL1β‐double‐positive area over total tumor area from sections after each injection regime quantified from the regions imaged in (J)–(L) and (P)–(R). Accompanying schematics illustrate fish age, timeline, type of injection (local, single or multiple), and imaged area (black outlined box) used for each experiment. Data are pooled from two independent experiments, and analyzed using Kruskal–Wallis test with Dunn's multiple comparisons test, ns p ≥ 0.05, ****p < 0.0001. Graph shows mean ± SEM, each dot represents one section and blue dots correspond to the representative images shown in the panels. n = number of sections/fish; PCs = protocells. Scale bars = 2 mm (A), 500 µm (B), 200 µm (C), 25 µm (D,E), 5 µm (H), 300 µm (J,P), 100 µm (M,S).

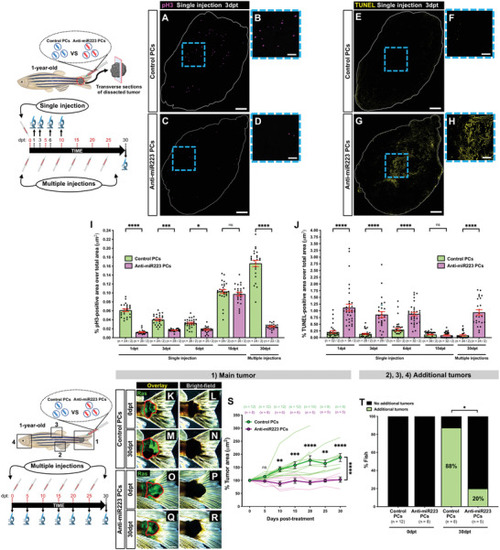
Anti‐miR223 protocell treatment reduces cancer progression in adult zebrafish. A–H) Single‐channel confocal images of immunostained cryosections from 1‐year‐old adult tail tumors at 3 dpt after a single local injection of unlabeled control protocells (A,B,E,F) or unlabeled anti‐miR223 protocells (C,D,G,H); white lines indicate tumor margins; proliferating cells are revealed by anti‐pH3 immunostaining (magenta) in (A)–(D) and apoptotic cells revealed by TUNEL staining (yellow) in (E)–(H). B,D,F,H) High magnification views of (A), (C), (E), and (G). I,J) Graphs showing percentage of pH3‐positive (I) or TUNEL‐positive (J) area over total tumor area from sections after each injection regime quantified from the regions imaged in (A), (C), (E), and (G). K–R) Multi‐channel (K,M,O,Q) or single‐channel (L,N,P,R) images of 1‐year‐old adult tail tumors (red outlines) at 0 and 30 dpt after multiple local injections of unlabeled control protocells (K–N) or unlabeled anti‐miR223 protocells (O–R). S) Graph showing adult tail tumor growth curves after each protocell treatment quantified from the regions imaged in (K)‐(R) and (1). See also Figure S15, Supporting Information. T) Bar chart showing percentage of fish bearing tailfin tumors, and any additional tumor (or not), after each protocell treatment at 0 and 30 dpt quantified from the regions imaged in (2)–(4). Accompanying schematics illustrate fish age, timeline, type of injection (local, single or multiple), and imaged area (black outlined box) used for each experiment. Data are pooled from two independent experiments, and analyzed using Kruskal–Wallis test with Dunn's multiple comparisons test (I,J), two‐way ANOVA test with Bonferroni's multiple comparisons test (S), or Fisher's exact test (T), ns p ≥ 0.05, *p < 0.05, **p < 0.01, ***p < 0.001, ****p < 0.0001. Graphs (I), (J), and (S) show mean ± SEM. In graphs (I) and (J), each dot represents one section and blue dots correspond to the representative images shown in the panels. In graph (S), each dot represents the mean of all fish analyzed and curves in lighter color correspond to individual fish. n = number of sections/fish (I,J); n = number of fish (S,T); PCs = protocells. Scale bars = 300 µm (A,C,E,G), 100 µm (B,D,F,H), 2 mm (K,M,O,Q).

Acknowledgments
This image is the copyrighted work of the attributed author or publisher, and ZFIN has permission only to display this image to its users. Additional permissions should be obtained from the applicable author or publisher of the image. Full text @ Adv Sci (Weinh)