IMAGE

Figure 7

ID
ZDB-IMAGE-221226-175
Source
Figures for López-Cuevas et al., 2022
Image
Figure Caption

Figure 7

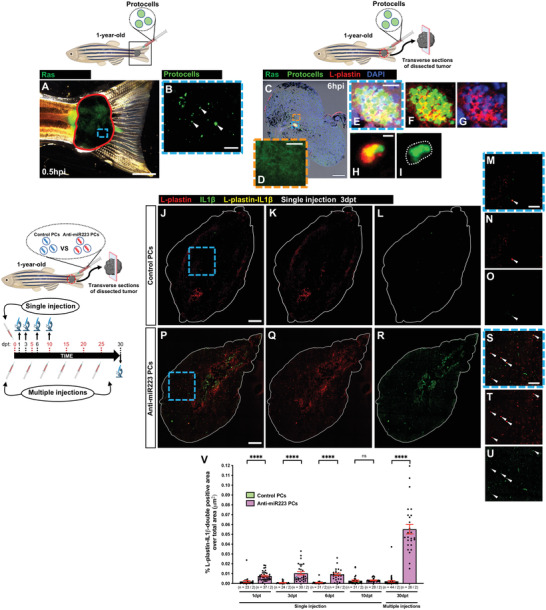
Uptake of anti‐miR223 protocells induces a leukocyte pro‐inflammatory state in adult zebrafish. A) Multi‐channel image of a 1‐year‐old adult tail tumor (red outline) locally injected with FITC‐protocells and imaged at 0.5 hpi. B) High magnification view of (A) showing a single‐channel image of FITC‐protocells (white arrowheads) at the injection site. C) Multi‐channel confocal image of an immunostained cryosection from a 1‐year‐old adult tail tumor harvested 6 h after local FITC‐protocell injection; nuclei are stained with DAPI (blue), and leukocytes are revealed by anti‐L‐plastin immunostaining (red). D) High magnification view of (C) showing single‐channel confocal image of Ras‐GFP region. E–I) High magnification views of (C) showing multi‐channel (E–H) or single‐channel (I) confocal images of FITC‐protocells within L‐plastin‐positive cells (white dotted outline in [I]). See also Figure S14, Supporting Information. J–U) Multi‐channel (J,M,P,S) or single‐channel (K,L,N,O,Q,R,T,U) confocal images of immunostained cryosections from 1‐year‐old adult tail tumors at 3 dpt after a single local injection of unlabeled control protocells (J–O) or unlabeled anti‐miR223 protocells (P–U); white lines indicate tumor margins; leukocytes are revealed by anti‐L‐plastin immunostaining (red) and IL1β revealed by anti‐IL1β immunostaining (green). (M–O,S–U) High magnification views of (J)–(L) and (P)–(R); white arrowheads indicate L‐plastin‐IL1β‐double‐positive cells (yellow). V) Graph showing percentage of L‐plastin‐IL1β‐double‐positive area over total tumor area from sections after each injection regime quantified from the regions imaged in (J)–(L) and (P)–(R). Accompanying schematics illustrate fish age, timeline, type of injection (local, single or multiple), and imaged area (black outlined box) used for each experiment. Data are pooled from two independent experiments, and analyzed using Kruskal–Wallis test with Dunn's multiple comparisons test, ns p ≥ 0.05, ****p < 0.0001. Graph shows mean ± SEM, each dot represents one section and blue dots correspond to the representative images shown in the panels. n = number of sections/fish; PCs = protocells. Scale bars = 2 mm (A), 500 µm (B), 200 µm (C), 25 µm (D,E), 5 µm (H), 300 µm (J,P), 100 µm (M,S).

Acknowledgments
This image is the copyrighted work of the attributed author or publisher, and ZFIN has permission only to display this image to its users. Additional permissions should be obtained from the applicable author or publisher of the image. Full text @ Adv Sci (Weinh)