
Figure 4
- ID
- ZDB-FIG-221226-164
- Publication
- López-Cuevas et al., 2022 - Macrophage Reprogramming with Anti-miR223-Loaded Artificial Protocells Enhances In Vivo Cancer Therapeutic Potential
- Other Figures
- All Figure Page
- Back to All Figure Page
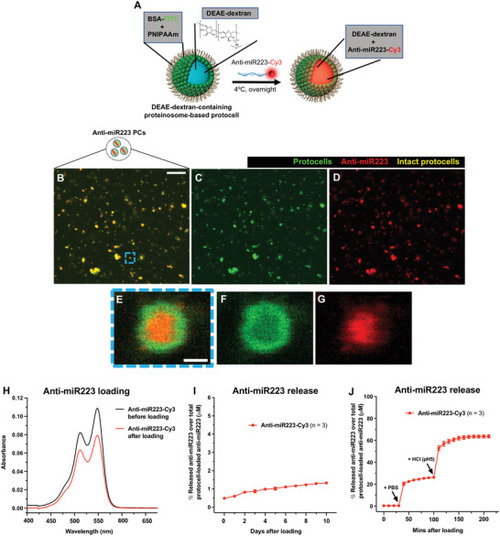
Loading strategy of anti‐miR223 into protocells. A) Schematic of the experimental design for loading DEAE‐dextran‐containing FITC‐protocells with anti‐miR223‐Cy3. B–G) Multi‐channel (B,E) or single‐channel (C,D,F,G) confocal images of FITC‐protocells after loading with anti‐miR223‐Cy3. E–G) High magnification views of (B)–(D) showing a single anti‐miR223‐Cy3 FITC‐protocell. H) Spectra showing absorbance quantification of the anti‐miR223‐Cy3 supernatant before and after protocell loading. I,J) Graphs showing percentage of anti‐miR223‐Cy3 released from loaded protocells into the supernatant over total anti‐miR223‐Cy3 concentration initially loaded into protocells, under normal conditions in H2O (I) or after exposure to PBS and HCl (J). Data are representative (H) or pooled (I,J) from three independent experiments. Graphs (I,J) show mean ± SEM, and each dot represents the mean of all experiments analyzed. |