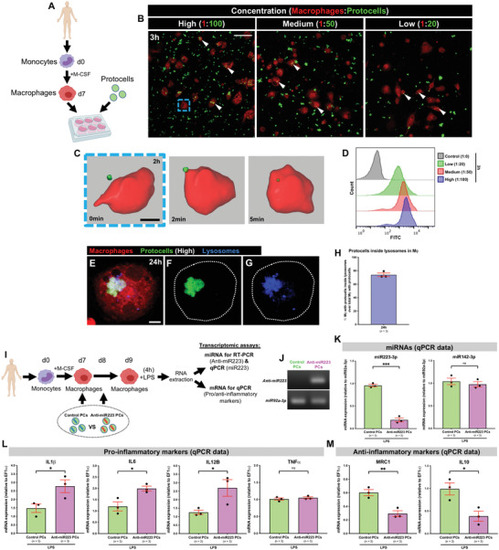
In vitro uptake of anti‐miR223 protocells by human macrophages enhances expression of pro‐inflammatory markers. A) Schematic of the experimental design; monocytes isolated from human donors undergo in vitro differentiation toward macrophages (via M‐CSF) prior to FITC‐protocell addition (day 7). B) Multi‐channel confocal images of human macrophages after incubation with different FITC‐protocell concentrations for 3 h; white arrowheads indicate protocells within macrophages. C) Imaris 3D reconstruction from confocal movie frames showing FITC‐protocell uptake by a human macrophage 2 h after protocell addition (blue dashed box in [B]). See also Movie S11, Supporting Information. D) Representative histograms from flow cytometry analysis of human macrophages treated with different FITC‐protocell concentrations for 3 h. See also Figure S10, Supporting Information. E–G) Multi‐channel (E) or single‐channel (F,G) confocal images showing the lysosomal fate of internalized FITC‐protocells within a human macrophage (white dotted outlines) 24 h after protocell addition. H) Graph showing percentage of human macrophages with overlaying protocells and lysosomes 24 h after protocell addition quantified from the regions imaged in (B). I) Schematic of the experimental timeline to evaluate human macrophage reprogramming and anti‐miR223 delivery/function (through transcriptomic analysis) after anti‐miR223 protocell treatment; FITC‐protocells, loaded with control anti‐miR or anti‐miR223, were administered to macrophage cultures in two consecutive doses (days 7 and 8) prior to LPS exposure for 4 h (day 9), and total RNA from macrophages was extracted for RT‐PCR and qPCR assays. J) RT‐PCR of miRNA extracted from human macrophages after each protocell treatment; anti‐miR223 from macrophages treated with control protocells was used as a negative control, and miR92a‐3p from macrophages of each protocell treatment as a loading control. K–M) Graphs showing qPCR data for the expression levels of miRNAs (miR223‐3p and miR142‐3p) (K), pro‐inflammatory markers (IL1β, IL6, IL12B, and TNFα) (L), and anti‐inflammatory markers (MRC1 and IL10) (M), in LPS‐stimulated human macrophages after each protocell treatment. See also Figures S11 and S12, Supporting Information. qPCR data were normalized to the indicated housekeeping genes/miRs from LPS‐stimulated macrophages that had not been treated with protocells. “High”, “medium”, and “low” correspond to the different macrophage:protocell ratios used (1:100, 1:50, and 1:20, respectively). Data are from one experiment (J), pooled from three independent experiments (H,K–M), or representative from two independent experiments (D), and analyzed using unpaired two‐sided t‐test, ns p ≥ 0.05, *p < 0.05, **p < 0.01, ***p < 0.001. Graphs show mean ± SEM, and each dot represents one experiment. Mϕ = macrophages; n = number of experiments; PCs = protocells. Scale bars = 50 µm (B), 10 µm (C), 5 µm (E).
|
