
- Title
-
Laminin-111 mutant studies reveal a hierarchy within laminin-111 genes in their requirement for basal epithelial tissue folding
- Authors
- Falat, E.J., Voit, G.C., Gutzman, J.H.
- Source
- Full text @ Dev. Biol.

The laminin-111 genes, lama1, lamb1a, lamc1, are all required for proper body axis and MHB structure. (A) Schematic representation of MHB tissue structure during development. (B) Neuroepithelial cell shape changes required for MHB folding. (C–G) Representative lateral brightfield images of embryos at 24 ss, WT (C), col4a5 mutant (D), and all three laminin-111 mutants, lama1 (E), lamb1a (F), and lamc1 (G). (C′-G′) Dorsal brightfield images of the same embryos as C-G. Anterior to the left and posterior to the right in all images. Arrowheads indicate the midbrain-hindbrain boundary constriction (MHBC). M, midbrain; H, hindbrain; MV, midbrain ventricle; HV, hindbrain ventricle. Scale bars: C-G 500 μm, C′-E′ 100 μm. |

lama1, lamb1a, and lamc1 are all required for proper MHB tissue angle. (A–E) Representative confocal images of memGFP injected embryos imaged at 24 ss, WT (A) and col4a5 (B), lama1 (C), lamb1a (D), lamc1 (E) mutants. (F) Quantification of angle measurements. Boxplots indicate the 25th and 75th percentiles and the median. At least three independent experiments are represented. n = 19 embryos for WT, 6 embryos for col4a5, 9 embryos for lama1 mutants, 6 embryos for lamb1a mutants, and 7 for lamc1 mutants. Significance values ∗∗∗P < 0.005. Yellow arrows along the basal edge of the tissue are representative of angle measurements. White arrowheads indicate the MHBC. M, midbrain; H, hindbrain. Scale bars: 20 μm. |
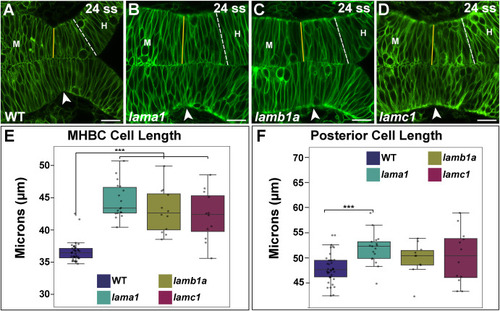
lama1, lamb1a, and lamc1 are all required for proper MHBC cell length. (A–D) Representative confocal images of memGFP injected embryos imaged at 24 ss, WT (A), and lama1 (B), lamb1a (C), lamc1 (D) mutants. (E–F) Quantification of cell length measurements at the MHBC and posterior region. Boxplots indicate the 25th and 75th percentiles and the median. At least three independent experiments are represented. n = 19 embryos for WT, 9 embryos for lama1 mutants, 6 embryos for lamb1a mutants, and 7 for lamc1 mutants. Significance values ∗∗∗P < 0.005. Solid yellow lines are representative of cells measured at the MHBC. White dotted lines are representative of cells measured 40 μm posterior to the MHBC toward the hindbrain. White arrowhead indicates MHBC. M, midbrain; H, hindbrain. Scale bars 20 μm. |

Anisotropic cell shape analysis. (A) Representative confocal image of a WT embryo injected with memGFP and imaged at 24 ss. The dashed yellow lines indicate apical and basal regions of the tissue where digital slices of the dorsal-ventral plane were taken. (B) Three-dimensional diagram of neuroepithelial cells at the MHB. Yellow rectangles represent where digital slices were taken in both the apical and basal regions of the cell. Approximate apical anisotropic shape can be visualized by dotted lines, while basal anisotropic shape can be visualized by narrow blue regions. (C–D) Representative digital slices in the anterior-posterior (x-axis) and dorsal-ventral (z-axis) dimension of apical (C) and basal (D) cellular regions of the MHB. Cells at the MHBC are outlined in yellow. (C′-D′) Representative measurements of cells in x-dimension (blue line) and z-dimension (red line). (E) Diagram of x:z ratios and their relationship to anisotropic cell shape. Scale bars 20 μm. |
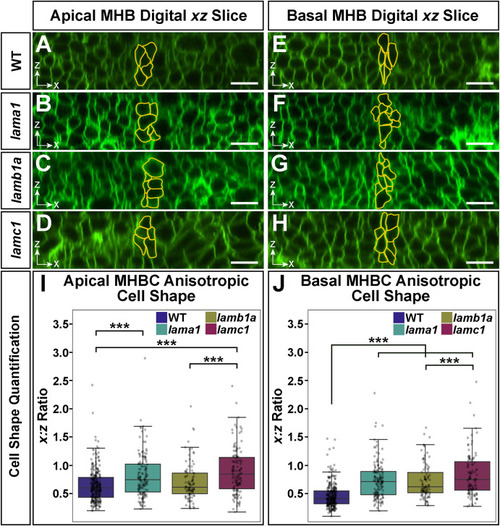
Individual loss of laminin-111 genes reveals a hierarchy in their requirement for apical and basal anisotropic cell shape change at the MHB. (A–H) Representative digital slice images of cells in the anterior-posterior (x-axis) and dorsal-ventral (z-axis) dimensions of embryos injected with memGFP and imaged at 24 ss. Cells at the MHBC are outlined in yellow within the apical region (A–D) and basal edge (E–H). (I–J) Apical and basal quantification of MHBC anisotropic cell shape (x:z ratio). Boxplots indicate the 25th and 75th percentiles and the median. At least three independent experiments are represented. n = 9 embryos for WT, 9 embryos for lama1 mutants, 6 embryos for lamb1a mutants, and 7 for lamc1 mutants. Significance values ∗∗∗P < 0.005. Scale bars: 20 μm. |
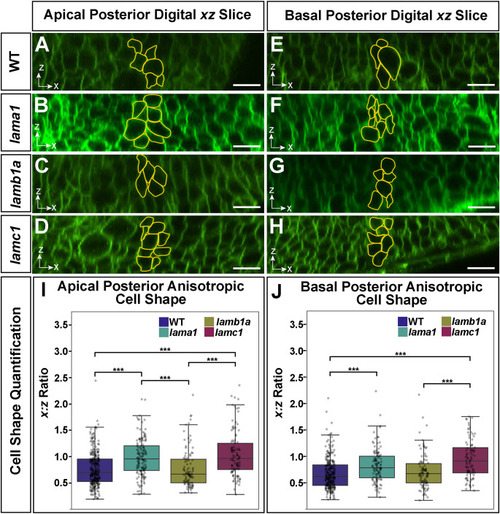
Laminin-dependent anisotropic cell shape hierarchy extends posteriorly to the hindbrain. (A–H) Representative digital slice images of cells in the anterior-posterior (x-axis) and dorsal-ventral (z-axis) dimensions of embryos injected with memGFP and imaged at 24 ss. Cells 40 μm posterior to the MHBC toward the hindbrain are outlined in yellow within the apical region (A–D) and basal edge (E–H). (I–J) Apical and basal quantification of posterior cell anisotropic cell shape (x:z ratio). Boxplots indicate the 25th and 75th percentiles and the median. At least three independent experiments are represented. n = 9 embryos for WT, 8 embryos for lama1 mutants, 6 embryos for lamb1 mutants, and 6 for lamc1 mutants. Significance values ∗∗∗P < 0.005. Scale bars 20 μm. |

Loss of lama1, lamb1a, and lamc1 results in abnormal basal accumulation of intracellular MRLC-GFP at the MHB. (A–E) Representative confocal images of WT-MRLC-GFP injected embryos imaged at 24 ss, WT (A), and mypt1 (B), lama1 (C), lamb1a (D), lamc1 (E) mutants. Yellow arrows represent directionality of intensity measurements that were taken from basal to apical. Light yellow region around arrow represents approximate 10 μm width included within measurements. (F–J) Normalized fluorescence intensity plot using quantification of average MRLC-GFP intensity from the basal edge to apical midline of the neuroepithelium at the MHB (blue and black lines). (G–J) Calculated p-values < 0.05 were graphed and overlayed on the intensity plots to indicate regions of significant intensity differences between mutants and WT (red lines). (K–O) Basal-to-apical regions were generated based upon basal-to-apical distance creating five equal groups, 1–5. Average area under the curve was calculated from average intensity values for each region within all genotypes. (P) Fluorescence intensity plot of MRLC-GFP from basal to apical of all genotypes shown together (data from F-J). (Q) Average area under the curve of region 1, the most basal region, of all genotypes (data from K–O). At least three independent experiments are represented. n = 6 embryos for WT, 7 embryos for mypt1 mutants, 12 embryos for lama1 mutants, 6 embryos for lamb1a mutants, and 8 for lamc1 mutants. Error bars in K–O represent standard deviation. Significance values ∗ P < 0.05, ∗∗P < 0.01, ∗∗∗P < 0.005. White arrowheads indicate the MHBC. Scale bars: 20 μm. |

Examination of the MHB at prim-15 highlights a differential capacity for basal tissue folding between lama1, lamb1a, and lamc1 mutants. (A–E) Representative dorsal brightfield images of embryos at prim-15, WT (A) and col4a5 (B), lama1 (C), lamb1a (D), and lamc1 (E) mutants. (F–J) Representative confocal images of embryos injected with memGFP and imaged at prim-15, WT (F) and col4a5 (G), lama1 (H), lamb1a (I), lamc1 (J) mutants. (F′-J′) Regions outlined by the dashed white boxes from F-J to visualize MHB angle. Yellow arrows along the basal edge of the tissue are representative of angle measurements. (K) Quantification of MHB angle at prim-15. Boxplots indicate the 25th and 75th percentiles and the median. At least three independent experiments are represented. n = 7 embryos for WT, 8 embryos for col4a5 mutants, 9 embryos for lama1 mutants, 8 embryos for lamb1a mutants, and 6 embryos for lamc1 mutants. Significance values ∗∗∗P < 0.005. Anterior to the left and posterior to the right in all images. Arrowheads indicate MHBC. M, midbrain; H, hindbrain; MV, midbrain ventricle; HV, hindbrain ventricle. Scale bars: (A–E) 100 μm, (F–J) 50 μm, (F′-J′) 50 μm. |
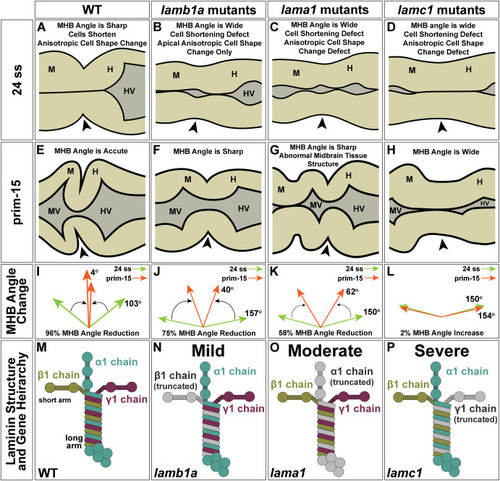
Laminin-111 mutant studies reveal a hierarchy within laminin-111 genes in their requirement for MHB basal tissue folding. (A–D) Schematic representation of MHB structure at 24 ss in WT (A) and lamb1a (B), lama1 (C), and lamc1 (D) mutants. Cell shape defects are indicated for each mutant. (E–H) Schematic representation of MHB structure at prim-15 in WT (E) and lamb1a (F), lama1 (G), and lamc1 (H) mutants. MHB angle defects are indicated for each mutant. (I–L) Diagram of changes in MHB angle from 24 ss to prim-15 in WT (I) and lamb1a (J), lama1 (K), and lamc1 (L) mutants. (M–P) Diagram of predicted laminin-111 protein structure and gene hierarchy between the laminin-111 genes. Arrowheads indicate MHBC. M; Midbrain; H, Hindbrain; MV, Midbrain Ventricle; HV, Hindbrain Ventricle. |
Reprinted from Developmental Biology, 492, Falat, E.J., Voit, G.C., Gutzman, J.H., Laminin-111 mutant studies reveal a hierarchy within laminin-111 genes in their requirement for basal epithelial tissue folding, 172-186, Copyright (2022) with permission from Elsevier. Full text @ Dev. Biol.