
- Title
-
A conserved transcriptional fingerprint of multi-neurotransmitter neurons necessary for social behavior
- Authors
- Ncube, D., Tallafuss, A., Serafin, J., Bruckner, J., Farnsworth, D.R., Miller, A.C., Eisen, J.S., Washbourne, P.
- Source
- Full text @ BMC Genomics
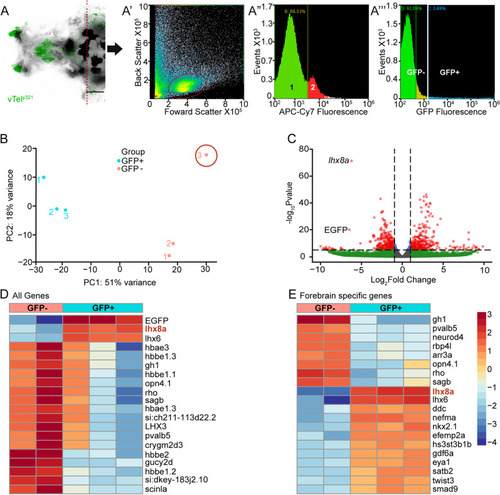
vTely321 transcriptome confirms its transgenic origin. A Dorsal view of vTely321 transgene expression in the forebrain and the dissection plane (dotted red line) for dissociation. Overlay of fluorescence (green) and transmitted light (greyscale). Scale bar = 100 μm. A’ FACS isolation of cell cluster (circled) after dissociation. A” Graph shows cutoff between live (1, green) (88.33%), and dead (2, red) cells (11.67%). A”’ Proportions of GFP positive (cyan, 3.69%) and negative cells (green, 92.09%) from the live cell fraction. B Principal component analysis of GFP positive and negative samples after variance stabilization transformation of gene count data. Sample 3 in the GFP negative fraction was dropped from subsequent analysis as an outlier. C Volcano plot of the ~ 23,000 genes expressed in the samples. Gray: Not significantly enriched and/or no fold change; Blue: significant differential expression (p < 0.05) but with fold change below threshold; Green: Up or downregulated (positive or negative fold change) without significant differential expression; Red: Significantly differentially regulated. D Heatmap of the 20 genes with the greatest differential expression between GFP positive and GFP negative samples. E Heatmap of the 20 forebrain specific genes with the greatest differential expression between GFP positive and GFP negative samples |

vTely321 neurons are both cholinergic and GABAergic. A Coronal sections of the adult ventral forebrain in the rostral telencephalon showing expression of the Et y321 transgene-dependent GFP, mRNA expression of vachtb and GABA immunolabeling. A’ Insets of boxed areas in A. Arrowheads point to selected vTely321 neurons that express vachtb and GABA (Scale bars: A = 100 μm; A’ = 50 μm). B Coronal sections of ventral forebrain depicting some nuclei in the forebrain that include vTely321 neurons and which provide anatomical positions used for rostro-caudal plane identification prior to quantification of vTely321 CGNs (RT, rostral telencephalon; MT, mid-telencephalon; and CT, caudal telencephalon; Vv, Ventral nucleus of the ventral telencephalon; Vd, dorsal nucleus of the ventral telencephalon; Vs, supracommisural nucleus; PPa, Parvocellular pre-optic nucleus; ac, anterior commissure) (scale bar: B = 100 μm). C Boxplots showing percentage of adult vTely321 neurons that are cholinergic and GABAergic at selected anatomical forebrain landmarks. N = 4 |

CGN phenotype is constant throughout development. Expression of cholinergic and GABAergic markers between 1 and 4 dpf. A Transverse section at 1 dpf showing expression of cholinergic (ChAT) and GABAergic (GABA) immunolabeling. A’, A”, B′, B″, and C′, C″. Rectangular boxes in A’ define selected areas, shown at higher magnification in A”, containing neurons labeled with the respective image color. Red arrows label vTely321 neurons, cyan arrows cholinergic vTely321 neurons, and yellow arrows label GABAergic vTely321 neurons. Merged images showing vTely321 neurons labeled (white arrows) that are cholinergic and GABAergic from 1dpf to 4dpf. A”, B″ and C″ inserts from areas defined in A’, B′ and C′. Arrows in merged images A’, B′, and C′ and inserts A”, B” and C” show selected vTely321 neurons that are cholinergic and GABAergic. B, C Coronal sections of ventral telencephalon showing cholinergic and GABAergic markers in vTely321 neurons at 2 and 4 dpf. (Scale bar for all images = 20 μm). D Boxplots showing the percentage of vTely321 neurons that are CGNs at 2 and 4 dpf |

LIMTF genes are expressed throughout development. A-C Wholemount chromogenic ISH in 20 hpf embryos showing expression of lhx8a, lhx6 and isl1 (left to right). Arrows label the principal foci of LIMTF gene expression in the brain. Magenta arrows denote telencephalic clusters and white arrows denote diencephalic clusters respectively at that timepoint. islet1 is more broadly expressed compared to lhx8a and lhx6. D-F 24 hpf larval forebrain transverse sections showing LIMTF gene expression in vTely321 neurons. D lhx8a mRNA expression in vTely321 neurons. E lhx6 mRNA expression in vTely321 neurons. F islet1 protein expression in vTely321 neurons. G-I. Coronal sections of the adult ventral forebrain showing (left to right) expression of lhx8a, lhx6 and isl1 in vTely321 neurons. Selected neurons that express the representative transcripts are denoted by white arrows. (Scale bars: A-C = 50 μm; scale bar in R’ represents D, D′, E, E’, F, F′, G, G’, I, I′ = 30 μm; scale bar in F″ represents D″, E”, F″, G”, H″, I″ = 30 μm) |
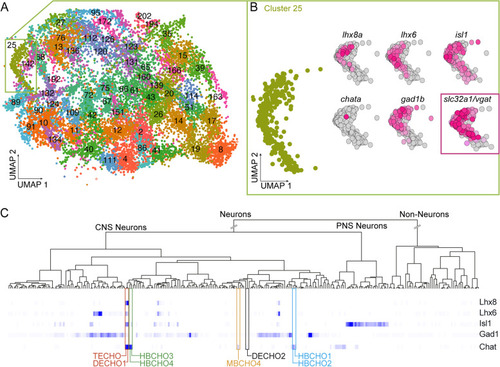
vTely321 “transcriptomic fingerprint” is evolutionarily conserved. A Single cell RNA-sequencing data from Atlas of Zebrafish Development plotted using Uniform Manifold Approximation and Projection (UMAP) algorithm. The atlas consists of 220 computationally identified clusters and each of the clusters were annotated using cell-type information from previously identified marker genes from the Zebrafish Information Network (ZIFN). B “Transcriptomic fingerprint” expressed genes map onto Cluster 25 of the Atlas and their expression is plotted in UMAP space. Vgat expression in Cluster 25 included as a corroboratory marker. C Search results from the mousebrain.org online scRNAseq Atlas show that combined expression of Lhx6, Isl1, Lhx8, Gad1 and Chat maps onto telencephalic (TECHO) and diencephalic (DECHO1) clusters in the mouse brain. Other cholinergic clusters HBCHO1–4, MBCHO4, and DECHO2 do not express the full transcriptomic fingerprint |