
- Title
-
Assessment of endocytic traffic and Ocrl function in the developing zebrafish neuroepithelium
- Authors
- Williams, D.M., Gungordu, L., Jackson-Crawford, A., Lowe, M.
- Source
- Full text @ J. Cell Sci.

Imaging of endocytic tracer uptake and trafficking in the zebrafish neuroepithelium. (A,B) Schematic of tissue organisation within the developing zebrafish brain in 1 dpf embryos as viewed by confocal microscopy from coronal (A) and sagittal (B) perspectives. Dashed boxed regions indicate the regions imaged. Neuroepithelial cell membranes are labelled with transiently expressed membrane-GFP. The positions of the forebrain (‘F’), midbrain (‘M’) and hindbrain (‘H’) ventricle are indicated, with the needle showing the region injected with endocytic tracers. Dashed lines indicate apical and basolateral neuroepithelial tissue boundaries. (C) Hindbrain ventricle injection of TxR–dextran accumulates in EGFP–Rab7-labelled compartments at 15 min post injection and to a greater degree at 60 min post injection. (D) Hindbrain ventricle injection of DQ-BSA imaged in live embryos 1 h post injection shows accumulation of DQ-BSA in EGFP–Rab7-positive compartments but not in EGFP–Rab5-labelled compartments. Arrowheads point to instances of co-localisation between stably expressed EGFP–Rab5 or EGFP–Rab7 and the indicated tracer. Images are representative of a minimum of two independent experiments. Scale bars: 50 µm (A, left); 10 µm (B); 5 µm (A, right; C,D). |
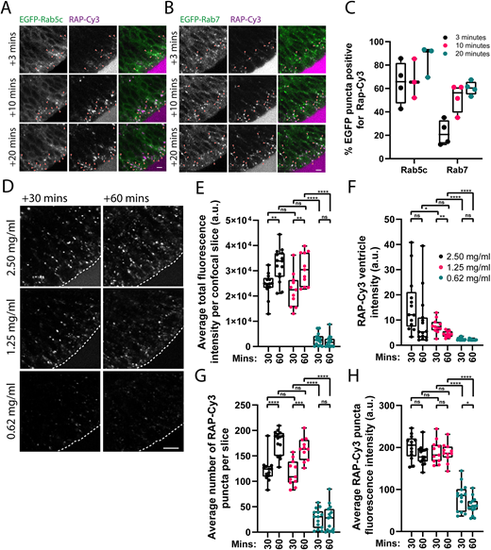
Characterisation of neuroepithelial RAP endocytosis and endocytic trafficking. (A,B) Confocal microscopy images of RAP–Cy3 co-localisation with stably expressed EGFP–Rab5c (A) or EGFP–Rab7 (B) in live zebrafish embryos at 3, 10 and 20 min post injection of 2.5 ng of RAP–Cy3 into the hindbrain ventricle. Arowheads indicate co-localisation between RAP–Cy3 and EGFP–Rab5c or EGFP–Rab7. Scale bars: 5 µm. (C) Quantification of co-localisation of RAP–Cy3 and EGFP–Rab5c (n=3), and RAP–Cy3 and EGFP–Rab7 (n=4) at the indicated timepoints. Each datapoint represents one individual embryo. Error bars show the s.d. (D) Representative confocal microscopy images from live imaging of RAP–Cy3 accumulation in neuroepithelial cells at 30 and 60 min post injection of 2.5, 1.25 or 0.625 mg/ml RAP–Cy3. Scale bar: 10 µm. (E–H) Quantification of the average total fluorescence intensity per confocal slice (E), RAP–Cy3 ventricle intensity at 30 or 60 min (F), the average number of RAP–Cy3 puncta per confocal slice (G) and the average segmented RAP–Cy3 punctum fluorescence intensity (H) post hindbrain injection of the indicated concentrations of RAP–Cy3 (2.5 mg/ml, n=15; 1.25 mg/ml, n=11; 0.625 mg/ml, n=15). a.u. arbitrary units. ns, not significant; *P<0.05; **P<0.01; ***P<0.001; ****P<0.0001. Statistical comparisons between groups were made using two-tailed unpaired Student's t-test. |

Ocrl regulates receptor recycling and trafficking of endocytic ligands in zebrafish neuroepithelial cells. (A) Representative confocal images of endocytic uptake of RAP–Cy3 30 min post hindbrain ventricle injection in live ocrl mutant embryos (n=14) or WT controls (n=19). Scale bar: 10 µm. (B–E) Quantification of the average total fluorescence intensity per confocal slice (B), average number of RAP–Cy3 puncta per confocal slice (C), average RAP–Cy3 punctum fluorescence intensity (D) and RAP–Cy3 ventricle intensity (E) at 30 min post hindbrain injection of RAP–Cy3 in WT and ocrl mutant embryos. (F) Representative confocal microscopy images of fixed tissue sections from WT (n=17) or ocrl mutant (n=22) embryos stained with antibodies against EEA1. Scale bar: 5 µm. (G) Quantification of EEA1-positive endosome size in WT and ocrl mutant embryos. (H) Representative confocal microscopy images of fixed tissue sections through the zebrafish hindbrain from WT (n=14) or ocrl mutant (n=12) embryos stained with antibodies against Lrp2. Scale bar: 5 µm. (I) Quantification of the mean Lrp2 fluorescence intensity from WT or ocrl mutant embryos. a.u. arbitrary units. ns, not significant; *P<0.05; **P<0.01; ***P<0.001. Statistical comparisons between groups were made using two-tailed unpaired Student's t-test. |
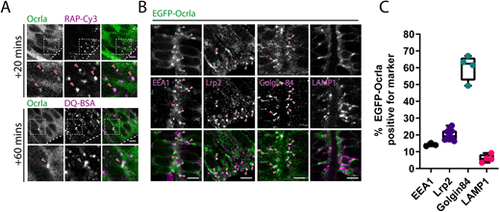
Ocrl localises to early endocytic compartments in neuroepithelial cells. (A) Representative confocal images of live 28 hpf zebrafish embryos transiently expressing EGFP–Ocrla after hindbrain ventricle injection of RAP–Cy3 or DQ-BSA. Regions within the dashed boxes are magnified in the lower panels. Arrowheads point to co-localisation between Ocrla signal and RAP–Cy3 or DQ-BSA. Scale bars: 5 µm. (B) Representative images of fixed tissue sections through the hindbrain of embryos transiently expressing EGFP–Ocrla and stained with antibodies against EEA1, Lrp2, Golgin-84 or LAMP1. Arrowheads indicate instances of co-localisation between Ocrla and the indicated marker. Scale bars: 5 µm. (C) Quantification of co-localisation between Ocrla puncta and EEA1 (n=3), Lrp2 (n=10), Golgin-84 (n=4) or LAMP1 (n=4) on fixed tissue sections. Each data point represents one individual embryo. Error bars represent the s.d. |
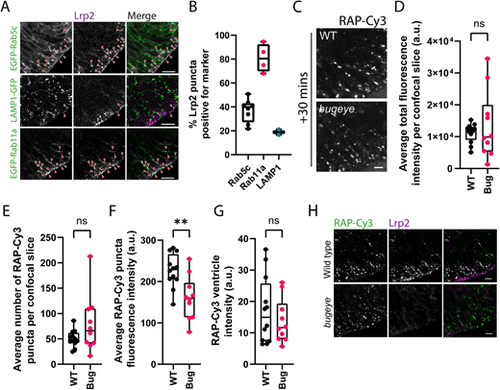
Analysis of neuroepithelial endocytic uptake of RAP in lrp2 knockout embryos. (A) Tissue sections collected from embryos transiently expressing EGFP-tagged Rab5c or Rab11a, or LAMP1–GFP at 28 hpf and stained with antibodies against Lrp2 to visualise Lrp2 localisation within the zebrafish neuroepithelium. Arrowheads point to examples of co-localisation between Lrp2 and the indicated marker. Scale bars: 10 µm. (B) Quantification of Lrp2 co-localisation with EGFP-tagged Rab5c (n=8) or Rab11a (n=4) or LAMP1–GFP (n=2). Each datapoint represents quantification from one individual embryo. Error bars show the s.d. (C) Assessment of endocytic uptake of RAP in lrp2 knockout bugeye embryos. Representative confocal microscopy images of live WT or lrp2-null zebrafish embryos following hindbrain ventricle injection of RAP–Cy3 imaged 30 min post injection. Scale bar: 5 µm. (D–G) Quantification of the average total fluorescence intensity per confocal slice (D), the average number of RAP–Cy3 puncta per confocal slice (E), the average RAP-Cy3 punctum fluorescence intensity (F) and RAP–Cy3 ventricle intensity (G) at 30 min post hindbrain injection of RAP–Cy3 in WT (n=12) and lrp2 knockout (n=10) embryos. (H) Tissue sections through the zebrafish hindbrain from WT or lrp2 knockout bugeye embryos injected with RAP–Cy3, fixed 30 min post injection and stained with antibodies against Lrp2. Scale bars: 10 µm. a.u. arbitrary units. ns, not significant; **P<0.01. Statistical comparisons between groups were made using two-tailed unpaired Student's t-test. PHENOTYPE:
|