
|
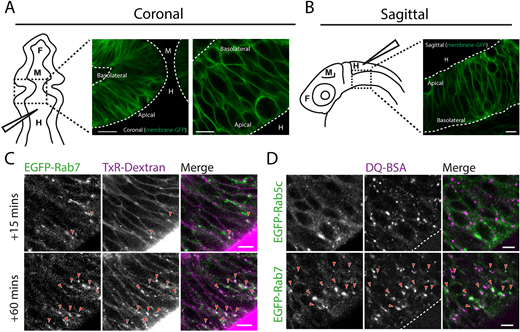
Fig. 1
Imaging of endocytic tracer uptake and trafficking in the zebrafish neuroepithelium. (A,B) Schematic of tissue organisation within the developing zebrafish brain in 1 dpf embryos as viewed by confocal microscopy from coronal (A) and sagittal (B) perspectives. Dashed boxed regions indicate the regions imaged. Neuroepithelial cell membranes are labelled with transiently expressed membrane-GFP. The positions of the forebrain (‘F’), midbrain (‘M’) and hindbrain (‘H’) ventricle are indicated, with the needle showing the region injected with endocytic tracers. Dashed lines indicate apical and basolateral neuroepithelial tissue boundaries. (C) Hindbrain ventricle injection of TxR–dextran accumulates in EGFP–Rab7-labelled compartments at 15 min post injection and to a greater degree at 60 min post injection. (D) Hindbrain ventricle injection of DQ-BSA imaged in live embryos 1 h post injection shows accumulation of DQ-BSA in EGFP–Rab7-positive compartments but not in EGFP–Rab5-labelled compartments. Arrowheads point to instances of co-localisation between stably expressed EGFP–Rab5 or EGFP–Rab7 and the indicated tracer. Images are representative of a minimum of two independent experiments. Scale bars: 50 µm (A, left); 10 µm (B); 5 µm (A, right; C,D).