FIGURE SUMMARY
Title

Zebrafish as a Model to Unveil the Pro-Osteogenic Effects of Boron-Vitamin D3 Synergism

Authors
Sojan, J.M., Gundappa, M.K., Carletti, A., Gaspar, V., Gavaia, P., Maradonna, F., Carnevali, O.
Source
Full text @ Front Nutr

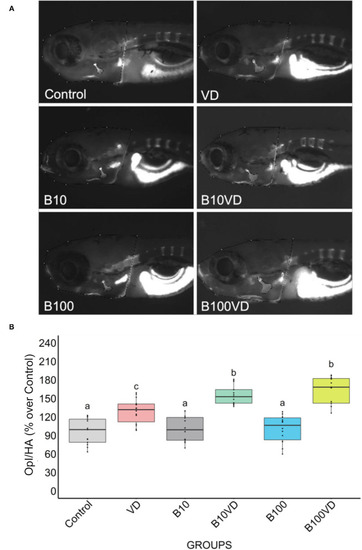
Fluorescence microphotograph of AR-S-stained larvae and ImageJ quantification of the opercular bone mineralization. (A) Mineralized bones stained by AR-S staining at 9 dpf following different treatments. (B) Quantitative analysis of the operculum bone integrated pixel density normalized by head area (Opl/HA) showed as % over control in fish treated with different concentrations of B and VD. Different letters above each graph indicate statistically significant differences among different groups. One-way ANOVA and Tukey's post-hoc test were used, and statistical significance was set at p < 0.05.

Sample clustering and DEGs across different combinations. (A) PCA of all the samples used in the experiment. (B) Hierarchical clustering of the top 1,500 DEGs across all the samples used in the experiment. (C) Number of upregulated and downregulated genes across different combinations of experimental groups.

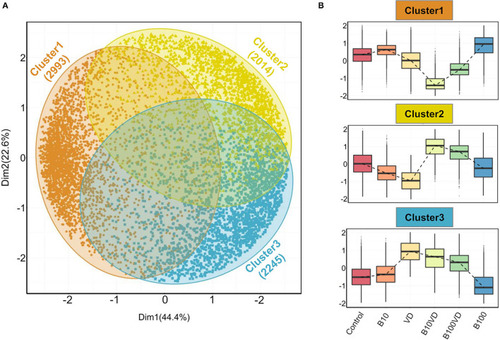
Outputs from PAM clustering of all the DEGs. (A) PCA visualizing the three clusters labeled cluster 1, cluster 2, and cluster 3 (indicated in orange, yellow, and blue colors, respectively) as defined by the PAM clustering. (B) Expression patterns of normalized gene expression values across different treatment groups in each of the three clusters. The expression counts were mean-centered before plotting them as box plots. The dashed lines within each panel connect the median values across different treatment groups.

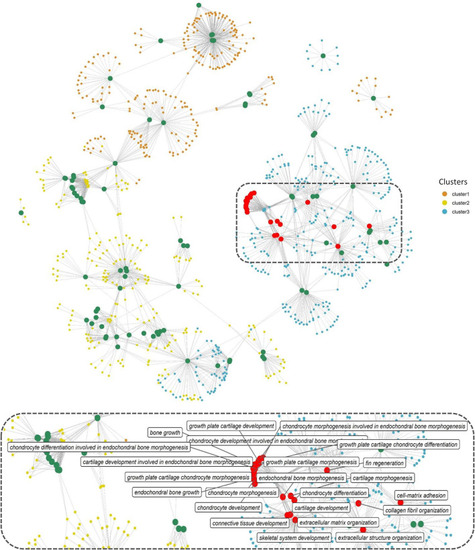
Network representation of enriched GO terms (BP) performed against the DEGs across three different clusters (Supplementary Table 4), the large-sized green and red-colored nodes indicate enriched GO terms, the red nodes in particular highlight GO terms in bone and skeleton system functioning, the region within the dashed rectangle is zoomed at the bottom of the network to highlight the nomenclature of key GO terms. Each small node of orange, green, and blue colors indicates a gene contributing to the enriched GO term across different clusters.

(A) Matrix visualizing the number of DEGs falling under enriched GO terms involved in skeletal system development. Y-axis highlights the key enriched GO terms, and X-axis describes the cluster number. The numbers within each circle indicate the total genes falling within that GO term in each cluster. (B) Bubble plot visualizing KEGG pathways significantly enriched (p < 0.05) across the three different clusters. Color of the bubbles indicates the cluster they fall into, and size of the bubble indicates the number of genes. (C) Heatmap visualizing normalized expression values of genes contributing to enriched skeletal GO terms in the cluster 3. Y-axis highlights the different treatment groups, and X-axis describes the enriched GO terms.

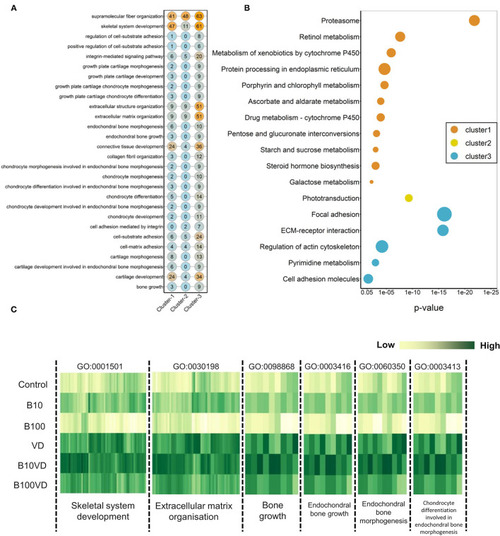
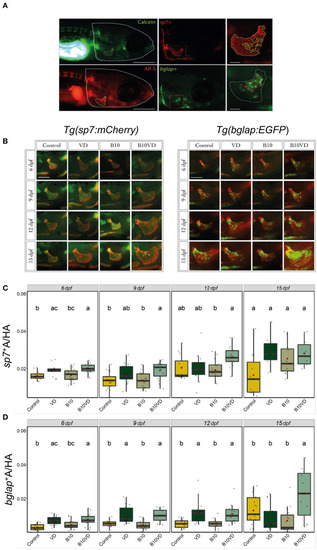
Early and mature osteoblasts respectively tracked by the fluorescence expression of Tg(sp7:mCherry) and Tg(bglap:EGFP). Four groups of treatment are ethanol at 0.1% (Control), VD group with VD3 at 10 pg/ml (VD), B at 10 ng/ml (B10), B at 10 ng/ml with VD3 at 10 pg/ml (B10VD). (A) An example of how the areas of the operculum and sp7+ and bglap+ were measured (big scale bar = 0.35 mm; small bar = 0.05 mm). (B) A table with merged pictures of operculum from the sp7:mCherry line stained with calcein and the bglap:EGFP line stained with AR-S (scale bar = 0.17 mm). (C) The sp7+ area inside the operculum was normalized with the total head area at time points 6, 9, 12, and 15 dpf. (D) The bglap+ area inside the operculum was normalized with the total head area at time points 6, 9, 12, and 15 dpf. One-way ANOVA and Tukey's post-hoc test were used. Data are presented as means ± SD, and different letters represent statistical significance at p < 0.05.

Acknowledgments
This image is the copyrighted work of the attributed author or publisher, and ZFIN has permission only to display this image to its users. Additional permissions should be obtained from the applicable author or publisher of the image. Full text @ Front Nutr