IMAGE

Figure 6

ID
ZDB-IMAGE-220518-8
Source
Figures for Sojan et al., 2022
Image
Figure Caption

Figure 6

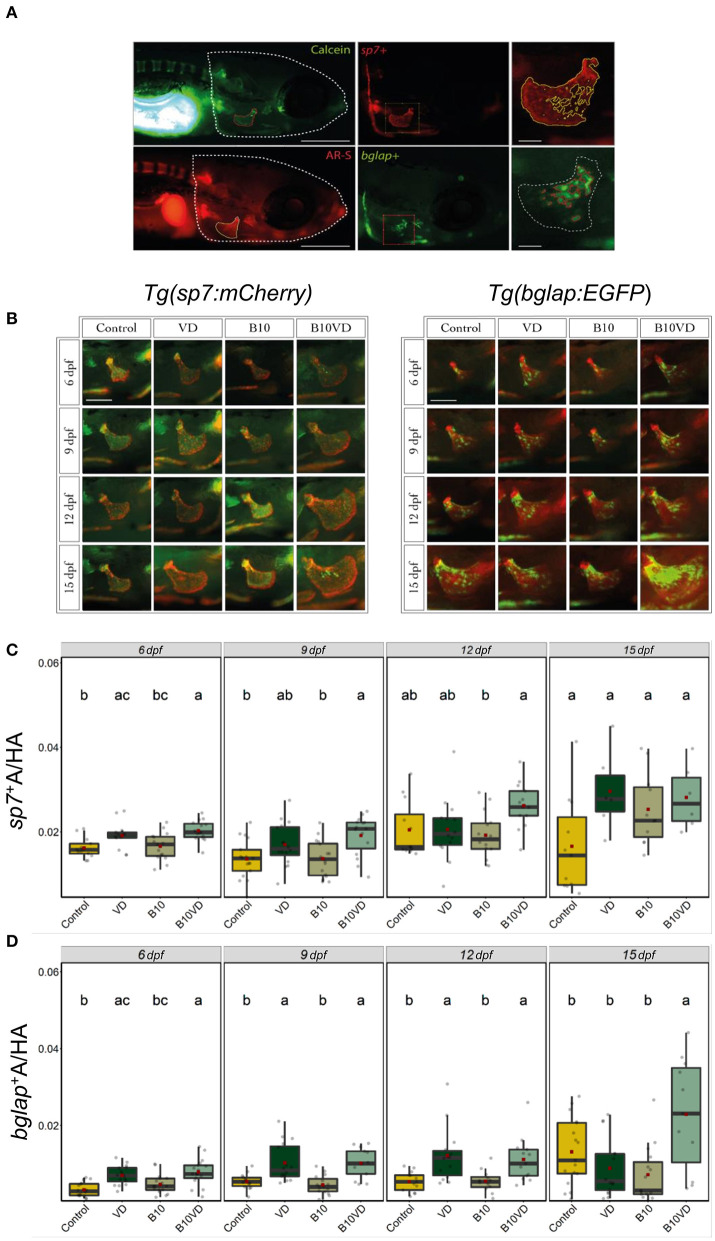
Early and mature osteoblasts respectively tracked by the fluorescence expression of Tg(sp7:mCherry) and Tg(bglap:EGFP). Four groups of treatment are ethanol at 0.1% (Control), VD group with VD3 at 10 pg/ml (VD), B at 10 ng/ml (B10), B at 10 ng/ml with VD3 at 10 pg/ml (B10VD). (A) An example of how the areas of the operculum and sp7+ and bglap+ were measured (big scale bar = 0.35 mm; small bar = 0.05 mm). (B) A table with merged pictures of operculum from the sp7:mCherry line stained with calcein and the bglap:EGFP line stained with AR-S (scale bar = 0.17 mm). (C) The sp7+ area inside the operculum was normalized with the total head area at time points 6, 9, 12, and 15 dpf. (D) The bglap+ area inside the operculum was normalized with the total head area at time points 6, 9, 12, and 15 dpf. One-way ANOVA and Tukey's post-hoc test were used. Data are presented as means ± SD, and different letters represent statistical significance at p < 0.05.

Acknowledgments
This image is the copyrighted work of the attributed author or publisher, and ZFIN has permission only to display this image to its users. Additional permissions should be obtained from the applicable author or publisher of the image. Full text @ Front Nutr