|
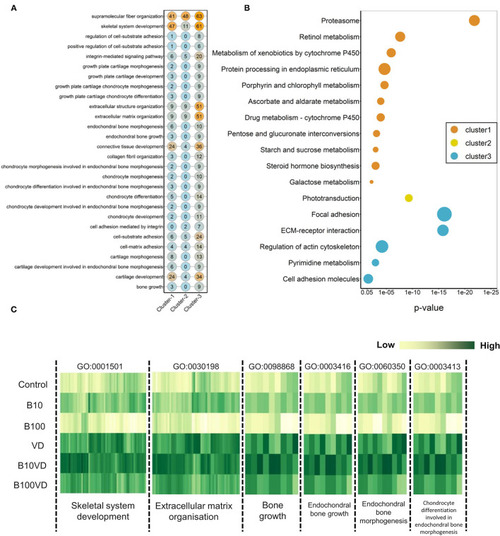
(A) Matrix visualizing the number of DEGs falling under enriched GO terms involved in skeletal system development. Y-axis highlights the key enriched GO terms, and X-axis describes the cluster number. The numbers within each circle indicate the total genes falling within that GO term in each cluster. (B) Bubble plot visualizing KEGG pathways significantly enriched (p < 0.05) across the three different clusters. Color of the bubbles indicates the cluster they fall into, and size of the bubble indicates the number of genes. (C) Heatmap visualizing normalized expression values of genes contributing to enriched skeletal GO terms in the cluster 3. Y-axis highlights the different treatment groups, and X-axis describes the enriched GO terms.
|