
- Title
-
Mammalian eIF4E2-GSK3β maintains basal phosphorylation of p53 to resist senescence under hypoxia
- Authors
- Sun, L., Yang, H., He, D., Chen, J., Dong, Z., Luo, S., Liang, H., Cao, Y., Cai, B., Zhang, M.
- Source
- Full text @ Cell Death Dis.
|
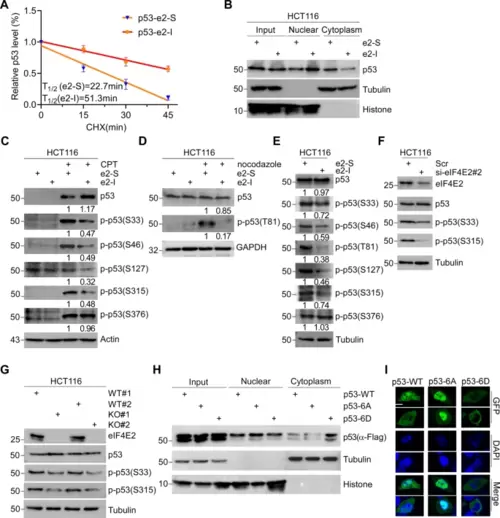
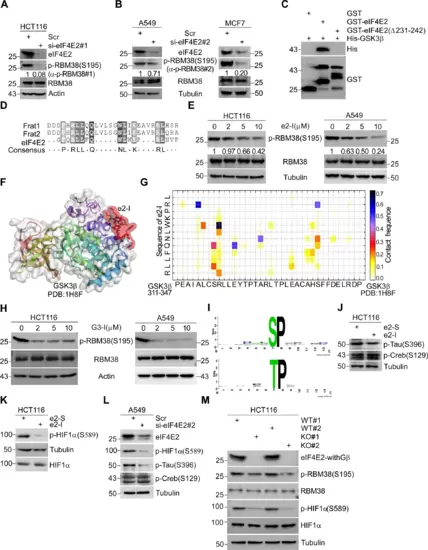
A HCT116 cells were treated with e2-I for 24 h followed by treatment with cycloheximide (CHX) for the indicated times. The intensity of p53 expression for each time point was quantified by grayscale analysis and plotted against time. B e2-I promotes nuclear localization of p53. Cells were treated with 5 μM e2-I or scrambled e2-S for 24 h, then the nuclear fraction was separated from the cytoplasmic fraction, followed by WB with antibodies against p53, Tubulin (markers for cytoplasmic), and Histone (markers for nuclear). C e2-I inhibits the CPT-induced phosphorylation of p53 at multi-S-P. Cells were treated with peptide as in (B), along with mock-treated or treated with 200 nM CPT for 24 h, followed by WB. D e2-I inhibits the nocodazole-induced phosphorylation of p53-Thr81. The experiment was done as described in (C), except that cell were mock-treated or treated with nocodazole (50 ng/ml). E e2-I inhibits multi-S/T-P phosphorylation of p53 at basal conditions. F Depletion of eIF4E2 inhibits the phosphorylation of p53-Ser33 and p53-Ser315. eIF4E2 siRNA#2 was transfected into HCT116 cells for 72 h, followed by WB with indicated antibodies. G Knockout of eIF4E2 inhibits the phosphorylation of p53-Ser33 and p53-Ser315. Lysis of eIF4E2-KO HCT116 (KO) and isogenic wild-type HCT116 (WT) cells, followed by WB with indicated antibodies. H Mutant p53-6A is preferentially located in the nuclear. Vectors expressing FLAG tagged p53, p53-6A or p53-6D, were transfected into p53-null HCT116 cells for 48 h. The nuclear and cytoplasmic fractions were separated, followed by WB. I Green fluorescent signals showed that mutant p53-6A is preferentially located in nuclear. Vectors expressing GFP-fused p53, p53-6A or p53-6D, were transfected into p53-null HCT116 cells for 24 h. GFP fluorescence and DAPI staining were observed using confocal microscopy. Scale bars, 5 μm. |
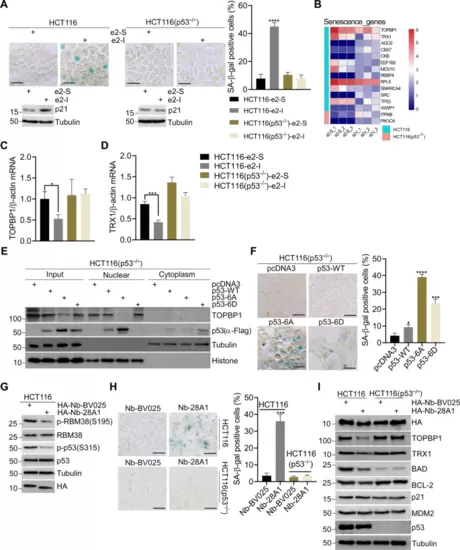
A SA-β-Gal staining of HCT116 and p53-null HCT116 cells treated with 5 μM e2-I or scrambled e2-S for 96 h (upper panel). And quantitative analysis percentages of SA-β-Gal positive cells (right panel n = 3). Followed by WB with indicated antibodies (lower panel). Scale bars, 25 μm. B Heat map showed the differential expression genes associated with senescence in HCT116 and p53-null HCT116 cells, respectively. Differential expression genes (DEGs) were identified upon e2-I treatment by RNA-Seq. C, D e2-I inhibits mRNA expression of TOPBP1 or TRX1 depending on p53. HCT116 or HCT116-p53 null cells were treated with 5 μM e2-I or scrambled e2-S for 24 h. Total RNA was extracted and real-time quantification reverse transcriptase polymerase chain reaction (QRT-PCR) was performed. E Mutant p53-6A suppresses the expression of TOPBP1. Vectors expressing FLAG tagged p53, p53-6A or p53-6D, were mock-transfected or transfected into p53-null HCT116 cells for 48 h. Then, the nuclear fraction was separated from the cytoplasmic fraction, followed by WB. F SA-β-Gal staining of p53-null HCT116 cells expressing FLAG tagged (p53-WT, p53-6A, p53-6D, and mock) for 96 h (left panel), and quantitative analysis of the percentages of SA-β-Gal positive cells (n = 3, right panel). Scale bars, 25 μm. G Expression of nanobody Nb-28A1 inhibits the phosphorylation of RBM38-Ser195 and p53-Ser315. Vector pcDNA3-HA-Nb-28A1 or control vector pcDNA3-HA-Nb-BV025 was transfected into HCT116 cells for 48 h, followed by WB with indicated antibodies. H Nanobody Nb-28A1 induced cell senescence depending on p53. SA-β-Gal staining of HCT116 or p53-null HCT116 cells expressing HA-Nb-28A1 or HA-Nb-BV025 for 96 h (left panel), and quantitative analysis percentages of SA-β-Gal positive cells (n = 3, right panel). Scale bars, 25 μm. I Expression of nanobody HA-Nb-28A1 for 24 h downregulates the expression of TOPBP1, TRX1, BCL2 or BAD depending on p53. Vector pcDNA3-HA-Nb-28A1 or control vector pcDNA3-HA-Nb-BV025 was transfected into HCT116 or p53-null HCT116 cells for 24 h, followed by WB with indicated antibodies. |
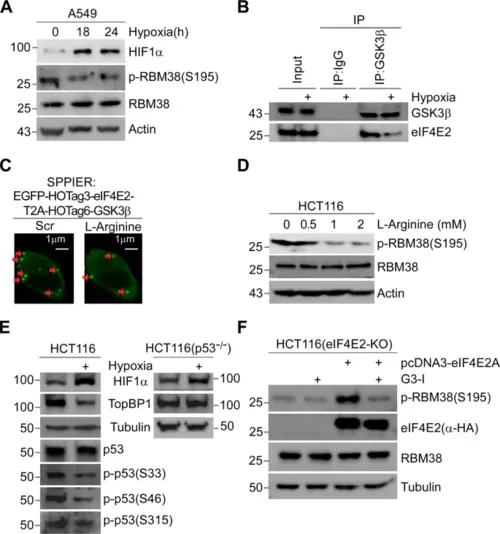
A Hypoxia inhibits the phosphorylation of RBM38-Ser195. A549 cells were exposure to hypoxia (1% O2) for 18, 24 h, or normoxia for 24 h, followed by WB. B Hypoxia inhibits eIF4E2-GSK3β binding. Cells were exposure to normal or hypoxia (1% O2) condition for 24 h. Then, cell extracts were subjected to Co-IP with anti-GSK3β antibody or IgG, followed by WB. C SPPIER assay showed L-Arginine inhibits eIF4E2-GSK3β interaction. Cells transiently expressed EGFP-eIF4E2-HOTag3-T2A-GSK3β-HOTag6, and then 2mM L-Arginine was added to the cells for 1 h. Scale bars, 1 μm. D L-Arginine inhibits the phosphorylation of RBM38- Ser195. Cells were mock-treated or treated with different concentrations of L-Arginine (0.5, 1, 2 mM) for 24 h and subjected to WB. E Hypoxia inhibits the phosphorylation of p53-Ser33, Ser46, Ser315 and the expression of TOPBP1. HCT116 (left) or p53-null HCT116 (right) cells were exposure to normoxia or hypoxia (1% O2) condition for 18 h, followed by WB with indicated antibodies. F Expression of eIF4E2 isoform A activates the phosphorylation of Rbm38-Ser195 in eIF4E2-KO HCT116 cells. Vectors expressing eIF4E2 isoform A with HA-tag were mock-transfected or transfected into eIF4E2-KO HCT116 cells for 48 h respectively, along with treatment with 5 μM G3-I or scramble peptide as indicated for 24 h, followed by WB. |

A Plasmids expressing CasRx-GFP, sgRNAs targeting eIF4E2 (sg-eIF4E2) or non-targeting (NT) guide RNAs were delivered to mouse livers by hydrodynamic tail-vein injection. 96 hr later, GFP+ hepatocytes were sorted for the quantification of mRNA or protein expression levels. B, C e2-I promoted liver senescence under intermittent hypoxia (IH). After intraperitoneal injection of 35 mg/kg e2-I or scrambled e2-S, mice were housed at normoxia or physiological hypoxia (12% O2) conditions and on the 5th day, liver tissue blocks were stained for SA-β-Gal activity (B), then sectioned and counterstained with nuclear fast red (C, left panel), and SA-β-Gal staining results were quantified by the ratio of SA-β-Gal+ area to the total image area for three fields (C, n = 3, right panel). Scale bars, 25 μm. D, E Nanobody Nb-28A1 promoted liver senescence under intermittent hypoxia (IH). AAV8-Nb-28A1 or AAV8-Nb-BV025 (1×10¹¹viral genomes in 100 μl saline) were intravenous injected. Two weeks later, mice were housed at normoxia or physiological hypoxia (12% O2) conditions and on the 5th day, liver tissue blocks were stained for SA-β-Gal activity (D, upper panel), equal amounts of liver tissue were subjected to WB for checking the expression of nanobody (D, lower panel). Then sectioned and counterstained with nuclear fast red (E, left panel), and SA-β-Gal staining results were quantified by the ratio of SA-β-Gal+ area to the total image area for three fields (n = 3) (E, right panel). Scale bars, 25 μm. F e2-I induced excessive senescence-associated secretory phenotype (SASP). Mice (6 weeks old) were injected intraperitoneally with 35 mg/kg e2-I or scrambled e2-S twice a week for 6 weeks. After each injection, the mice were exposed to physiological hypoxia (12% O2) conditions for 8 h. At 8 weeks, the levels of IL-6, IL-8 and IL-1β in serum of mice were detected by using ELISA kits. Data are presented as mean SD from each group (n = 3). G e2-I leads to liver fibrosis. The liver fibrosis of mice from experiment (F) was evaluated by Masson’s trichrome staining and representative results were shown (left panel). Scale bars, 50 μm. Quantified data of the fibrosis area (right panel). Statistical Significance was determined by one-way analysis of variance (n = 4 per group). H, I Scheme of e2-I/IH or senolytics drug (dasatinib and quercetin) administration of DEN-treated mice (upper panel). e2-I/IH treatment was performed as described in (F). Representative macroscopic photographs of livers (n = 6) indicate the hepatocellular carcinoma (HCCs) by arrowheads. Scale bar: 1 cm (H). Number of surface tumors and LW/BW ratios in mice liver at 24 weeks and shown in the scatter plot (n = 6) (I). J Representative SA-β-Gal staining of 24-week mouse liver sections from experiment (H) (left panel). Scale bar: 25 µm. SA-β-Gal staining results were quantified by the ratio of SA-β-Gal+ area to the total image area for three fields (n = 3) (right panel). |
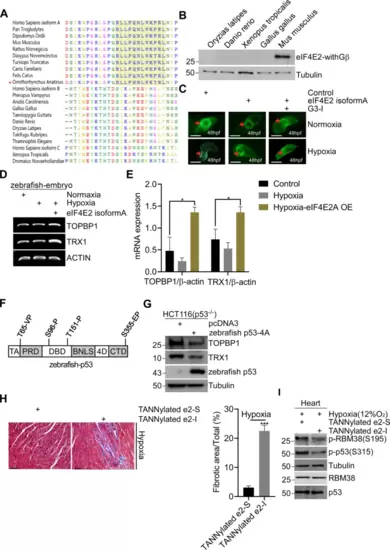
A Sequence alignment of c-termini of eIF4E2 from major species, including mammals, reptiles, amphibians, fish, and birds. B WB detects the protein expression of eIF4E2-withGβ isoforms in different non-mammals. C Human eIF4E2 isoform A prevents disorder of heart looping of zebrafish. Vectors expressing eIF4E2 isoform A were mock-injected or injected into embryos (n = 5) at the 1-cell stage. 24 h later, embryos were exposure to hypoxic (1% O2) or normoxia for 24 h, and representative Tg (cmlc2: eGFP) heart were showed at 48 h. D, E Expression of eIF4E2 isoform A increases the mRNA expression of TOPBP1 or TRX1 in zebrafish embryo. Total RNA was extracted and reverse transcriptase polymerase chain reaction (RT-PCR) was performed (D). Real-time quantification reverse transcriptase polymerase chain reaction (QRT-PCR) was performed (E). F S/T-P sites of zebrafish p53 were indicated. G Zebrafish p53-4A mutant suppresses the expression of TOPBP1 or TRX1. Vectors expressing Zebrafish p53-4A, were mock-transfected or transfected into p53-null HCT116 cells for 48 h, followed by WB. H TANNylated e2-I or e2-S was intravenously injected to mice twice a week for 6 weeks, followed by intermittent hypoxia (IH) exposure (12% O2 for 8 h after injection). Cardiac fibrosis was evaluated by Masson’s trichrome staining and representative macroscopic photographs of heart tissue was showed (n = 4) (left panel). Quantified data of the fibrosis area. Statistical significance was determined by one-way analysis of variance (n = 4) (right panel). I Mice were intravenously injected with TANNylated e2-I or e2-S, and housed at physiological hypoxia (12% O2) conditions for 48 h. Then, heart tissues were analyzed by WB. |