
|
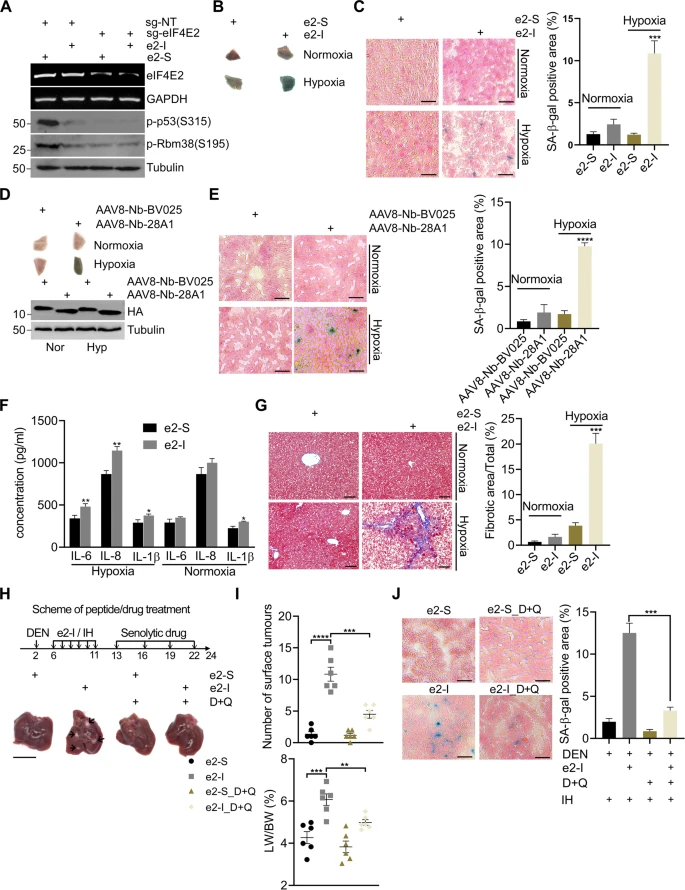
Fig. 5 A Plasmids expressing CasRx-GFP, sgRNAs targeting eIF4E2 (sg-eIF4E2) or non-targeting (NT) guide RNAs were delivered to mouse livers by hydrodynamic tail-vein injection. 96 hr later, GFP+ hepatocytes were sorted for the quantification of mRNA or protein expression levels. B, C e2-I promoted liver senescence under intermittent hypoxia (IH). After intraperitoneal injection of 35 mg/kg e2-I or scrambled e2-S, mice were housed at normoxia or physiological hypoxia (12% O2) conditions and on the 5th day, liver tissue blocks were stained for SA-β-Gal activity (B), then sectioned and counterstained with nuclear fast red (C, left panel), and SA-β-Gal staining results were quantified by the ratio of SA-β-Gal+ area to the total image area for three fields (C, n = 3, right panel). Scale bars, 25 μm. D, E Nanobody Nb-28A1 promoted liver senescence under intermittent hypoxia (IH). AAV8-Nb-28A1 or AAV8-Nb-BV025 (1×10¹¹viral genomes in 100 μl saline) were intravenous injected. Two weeks later, mice were housed at normoxia or physiological hypoxia (12% O2) conditions and on the 5th day, liver tissue blocks were stained for SA-β-Gal activity (D, upper panel), equal amounts of liver tissue were subjected to WB for checking the expression of nanobody (D, lower panel). Then sectioned and counterstained with nuclear fast red (E, left panel), and SA-β-Gal staining results were quantified by the ratio of SA-β-Gal+ area to the total image area for three fields (n = 3) (E, right panel). Scale bars, 25 μm. F e2-I induced excessive senescence-associated secretory phenotype (SASP). Mice (6 weeks old) were injected intraperitoneally with 35 mg/kg e2-I or scrambled e2-S twice a week for 6 weeks. After each injection, the mice were exposed to physiological hypoxia (12% O2) conditions for 8 h. At 8 weeks, the levels of IL-6, IL-8 and IL-1β in serum of mice were detected by using ELISA kits. Data are presented as mean SD from each group (n = 3). G e2-I leads to liver fibrosis. The liver fibrosis of mice from experiment (F) was evaluated by Masson’s trichrome staining and representative results were shown (left panel). Scale bars, 50 μm. Quantified data of the fibrosis area (right panel). Statistical Significance was determined by one-way analysis of variance (n = 4 per group). H, I Scheme of e2-I/IH or senolytics drug (dasatinib and quercetin) administration of DEN-treated mice (upper panel). e2-I/IH treatment was performed as described in (F). Representative macroscopic photographs of livers (n = 6) indicate the hepatocellular carcinoma (HCCs) by arrowheads. Scale bar: 1 cm (H). Number of surface tumors and LW/BW ratios in mice liver at 24 weeks and shown in the scatter plot (n = 6) (I). J Representative SA-β-Gal staining of 24-week mouse liver sections from experiment (H) (left panel). Scale bar: 25 µm. SA-β-Gal staining results were quantified by the ratio of SA-β-Gal+ area to the total image area for three fields (n = 3) (right panel).